Timeline
The timeline feature visualizes the development of major KPIs over the last 14 days as well as the prediction for the next 14 days. It can be used as visual confirmation of our forecast accuracy.
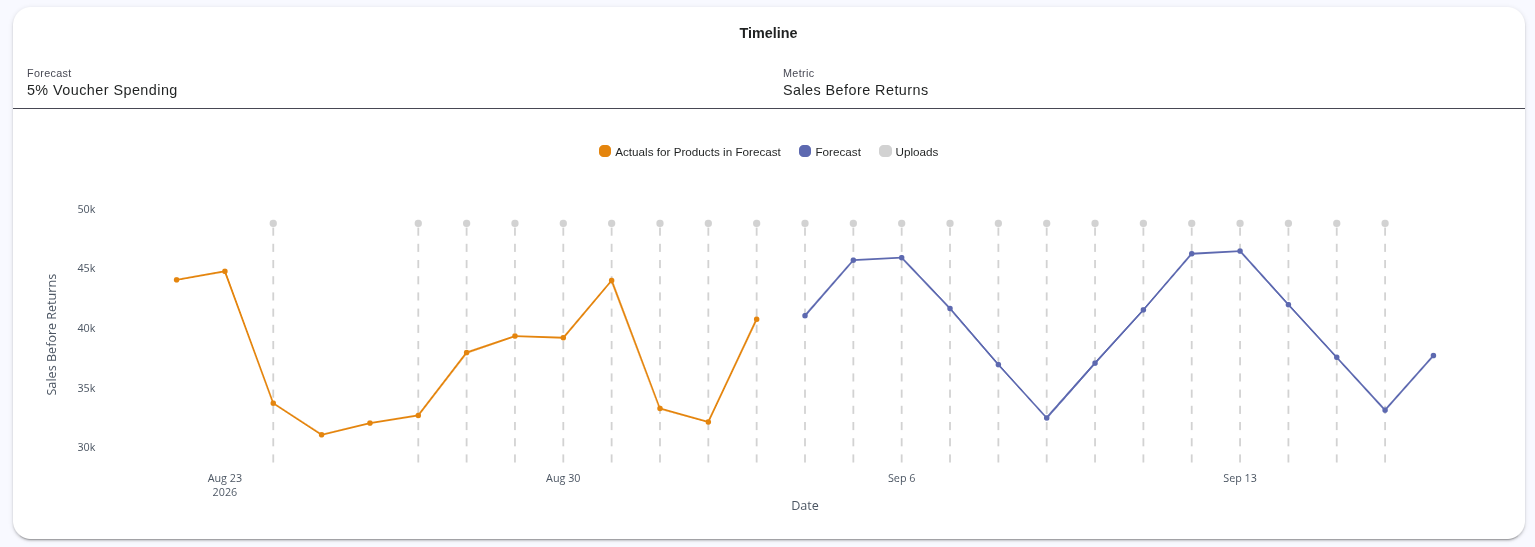
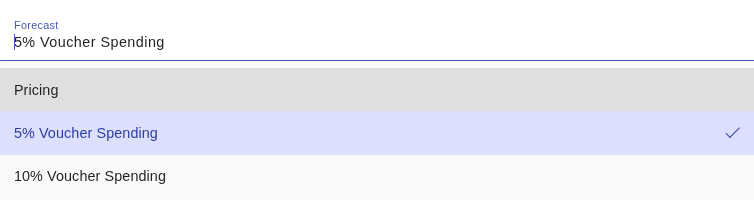
Forecast
The forecast dropdown enables the selection of alternative forecasts if multiple forecasts are available. The overall differences of the different variants can be explored easily like this.
Metrics
The metrics dropdown enables the selection of alternative KPIs for the chart. We currently support:
- Revenue Before Returns
- Sales Before Returns
