2026-04-15
Added
-
The Rules tab now supports sorting by rule ID.
-
Optimization tables now offer a 'Restricting Rules' filter, allowing you to easily find products affected by specific rules.
Changed
-
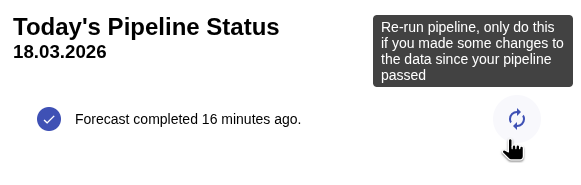
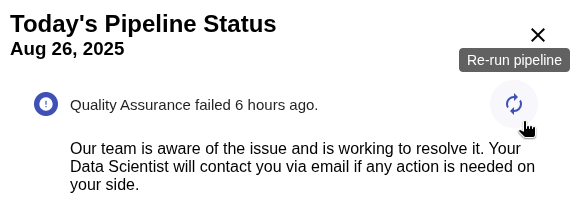
Rerunning successful pipelines is now possible.
2026-04-14
Fixed
-
Improved pipeline status messages to show the correct start time.
2026-04-09
Fixed
-
Improved security when retrieving instance events.
2026-04-08
Fixed
-
Minor tweaks and enhancements made.
2026-04-01
Changed
-
Standardized percentage KPI granularity across the application to include decimal values.
Fixed
-
Corrected alignment between "Why this price" price points and the corresponding price plot.
-
Fixed a bug where loading spinners did not update despite completed optimization/upload.
2026-03-26
Fixed
-
Resolves an intermittent problem with the scope count not updating.
2026-03-25
Added
-
Error messages are now more readable.
Fixed
-
An issue preventing rule errors from appearing during optimization creation has been resolved.
-
Helpdesk tickets now load reliably after a fix to subscriber email validation.
2026-03-24
Fixed
-
Helpdesk tickets now load reliably after a fix to subscriber email validation.
2026-03-18
Fixed
-
Fixed a visualization error for complex rules in the "Why this price price" view.
2026-03-12
Changed
-
Group management transitions to the Single-Sign-On service.
2026-03-11
Added
-
To ensure logical pricing across bundles and product groups, we now highlight optimizations where the scopes split product groups. If you see the [?] icon as status in your Optimizations Overview, some products within the groups in your optimization are currently missing from your scope.
Changed
-
Help Desk comments and status histories are now displayed in chronological order, with the oldest entry at the top.
-
The 'Targets' column in the optimizations overview has been renamed to 'Scopes' to better reflect the primary data shown. Targets per scope remain visible on-hover.
Fixed
-
Resolves an issue where product images were not shown in the dashboard.
-
Missing rules associated with pinned optimizations have been addressed.
2026-03-04
Added
-
Help desk email notifications now include the full content of the most recent comment.
2026-02-25
Fixed
-
Copying or editing scopes no longer unintentionally changes the original scope's description.
-
Resolves an issue where optimizations could time out if multiple were running simultaneously.
2026-02-19
Added
-
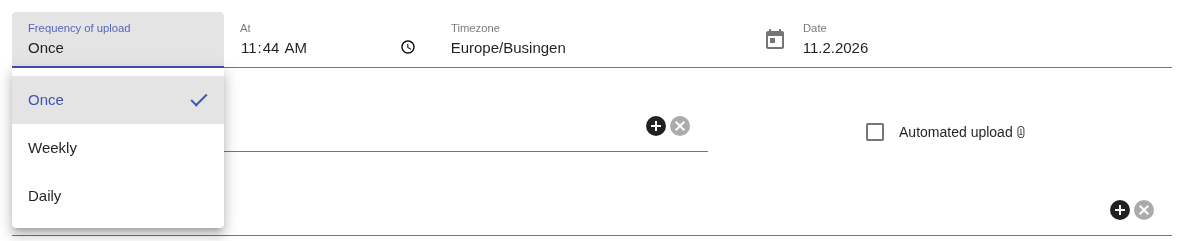
Introduced the ability to schedule a one-time upload without repetition.
-
Rule explanation in optimization dashboard now also displays rule group impact on pricing decision.
-
The optimization dashboard now displays summary KPIs with greater precision on hover.
Changed
-
The same KPI configuration is applied for both the preview and the compare plots.
Fixed
-
An issue preventing optimization comparisons from loading has been resolved.
2026-02-16
Fixed
-
Fix missing deployment location in cloud scheduler
2026-02-16
Added
- Support deployment in US region
2026-02-13
Fixed
-
An issue preventing optimization comparisons from loading has been resolved.
2026-02-11
Fixed
-
The compare table's date picker now correctly uses the chosen day instead of shifting to the previous one.
2026-02-04
Changed
-
The application's loading process was optimized.
2026-01-28
Added
-
Users can now filter for unset (missing) values within scope definitions and the optimization dashboard.
Changed
-
Multiselect input is now used for Boolean filter values, replacing the checkbox option.
Fixed
-
Fixed imprecisions in optimization preview in cases when difference between solutions was extremely small.
2026-01-22
Added
-
You can now filter help desk tickets to find what you need faster.

-
Notification for clients has been extended to include ticket creation.
Changed
-
Performance is enhanced as events for each instance are now loaded on demand when opening a timeline.
-
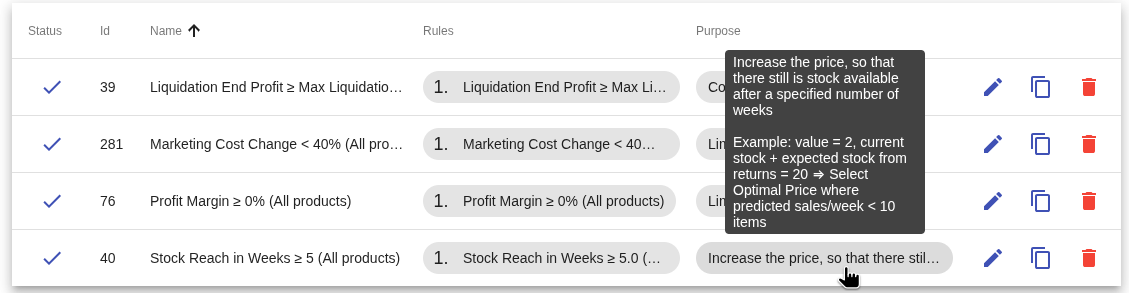
We’ve clarified the rule table by renaming "Definitions" to "Purpose." Hover over the items to see examples on hover.
2026-01-14
Added
-
Enable closing the survey after optimization creation.
Changed
-
The uploads page is now called Overview.

-
To ensure consistency with the Profit Margin, the aggregated Raw Profit Margin shown in the Optimization Preview and Comparison is now calculated based on predicted sales after returns.
2026-01-12
Changed
-
Allow S3 bucket owners to have full control over uploaded objects in the bucket.
2026-01-07
Fixed
-
Resolved the problem where rules could not be created using a 0.0 value.
2026-01-07
Changed
-
The value field is now displayed only when the selected rule template requires it.
-
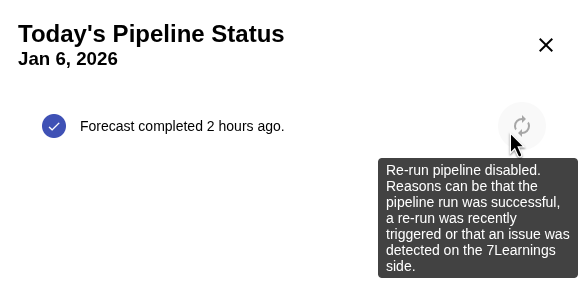
Better explain why rerun pipeline button is disabled.
Fixed
-
Users can now rerun pipelines when issues are client-side related.
-
Filtering for a non-existent item in optimization dashboard now correctly returns an empty result.
2025-12-29
Added
-
A new metric was added to upload timeline, illustrating the impact of Liquidation End Profit.
Changed
-
Selecting a group now refreshes the page.
-
The Landing page after login has been updated to the uploads page.
-
Percentage labels were updated to clearly distinguish between percentage point (pp) changes and relative percentage growth.
Fixed
-
Resolved an issue in optimization dashboard where product rule explanations included irrelevant rules under specific conditions.
-
Resolves an issue where numerical filters failed to operate correctly when the 'not equal' operator was applied.
2025-12-19
Fixed
-
Resolves an issue where numerical filters failed to operate correctly when the 'not equal' operator was applied.
2025-12-17
Added
-
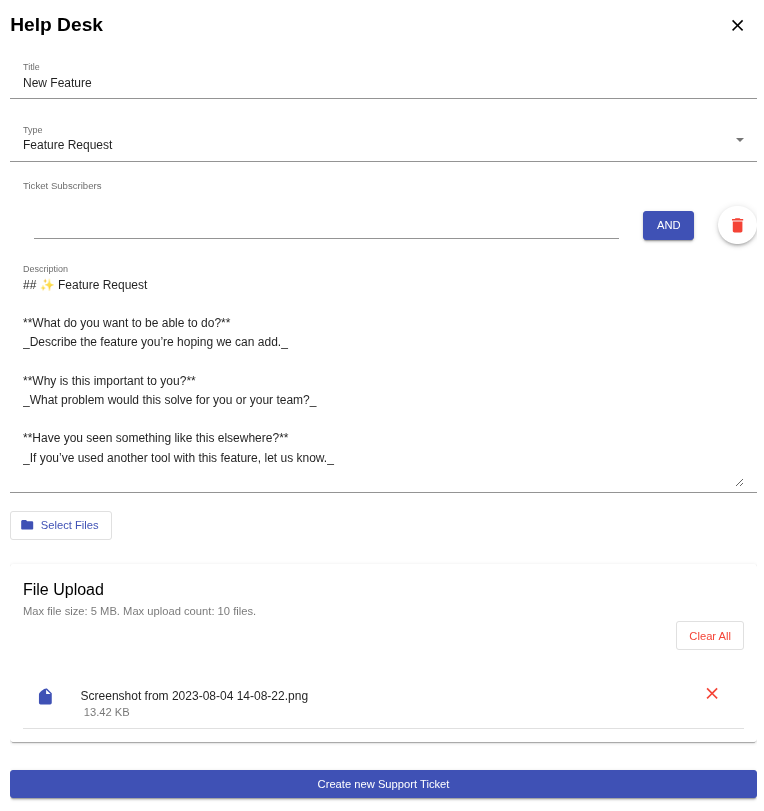
Added support for file attachments in the Help Desk section.
Fixed
-
Improves the experience by having expanded ticket rows maintain their position within the user's current sort and pagination view.
-
Fixed formatting of small fractions in upload timeline.
2025-12-11
Fixed
-
Resolved an issue where the optimization dashboard sometimes failed to load when navigating to it directly through a link.
-
Resolves a problem that could cause the scope count update process to fail unexpectedly.
2025-12-03
Added
-
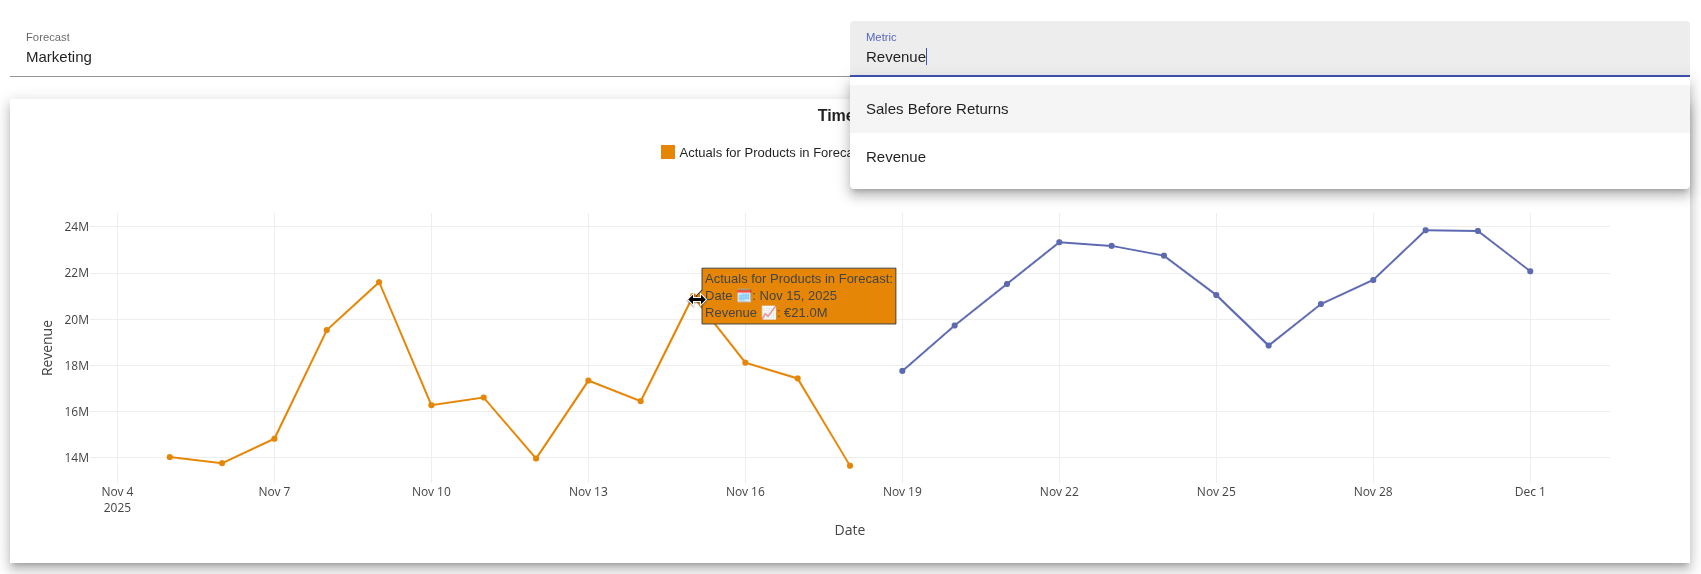
Improved the timeline dashboard on the Uploads page by adding Revenue as a selectable Y-axis option.
-
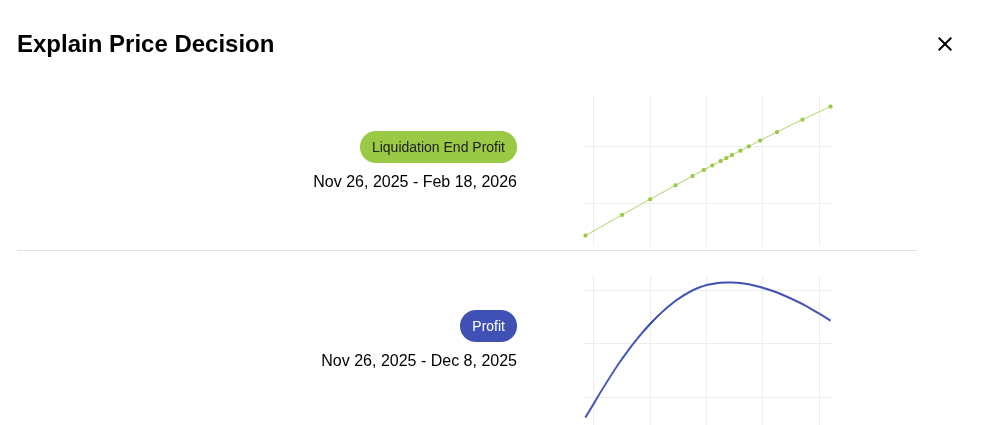
Dates have been integrated into the profit curves located within the explain tab.
Changed
-
Optimization Group Profits are now utilized to explain price and marketing changes. For instance, when all sizes of a product must have the same price, the explain curve shows the combined profit for all sizes instead of individual profits for each size.
-
New Feature: You can now send data to multiple channels at once using efficient batches. New filtering options have been added to the frontend to help you manage these selections easily.
-
System Update: We have updated the data transport system. Grouped CSV exports now use a long format data structure (replacing the old wide format).
⚠️ Important Note: Due to the switch to long format, grouped CSV exports are no longer compatible with existing Tradebyte pandas workflows. Please verify your data scripts and update them to handle the new format.
2025-11-28
Fixed
-
Resolved a minor issue affecting Snowflake uploads.
2025-11-26
Changed
-
The Snowflake upload feature now accommodates larger tables through its bulk upload capabilities.
2025-11-24
Added
-
Tradebyte upload now supports uploading larger optimizations via streaming uploads
2025-11-21
Fixed
-
Resolves an issue where project configurations could fail to update.
2025-11-19
Changed
-
The pipeline rerun interface now shows a disabled rerun button where it was previously absent.
Fixed
-
Resolves an issue where direct links to app pages (e.g link from emails) failed to open correctly if you had to log in first.
2025-11-12
Added
-
Additional KPIs are now available on hover for current prices point in the optimization preview.
Changed
-
The Timeline Monitoring section of the Uploads page now displays actual Sales Before Returns only for the products in the most recent forecast instead of all products before.'.
Fixed
-
Fixed optimization dashboard histogram not showing full range of X-axis ticks in some cases.
-
Small improvements for filtering in compare table.
-
Addresses an issue where optimization creation failed for scopes that contained datetime constraints.
2025-11-05
Fixed
-
Fixed failing scheduled uploads due to an issue with email notifications
2025-11-05
Added
-
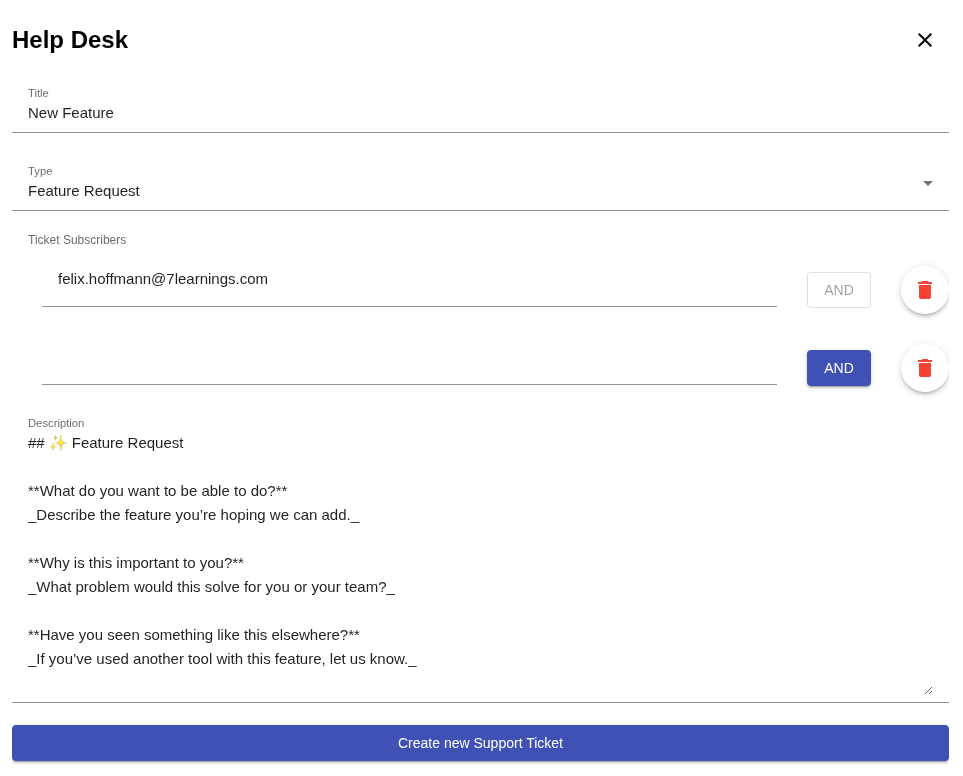
Subscribers now receive email notifications for new comments on tickets.
Changed
-
The filtering in the comparison table now has a consistent look and feel with the scope form.
-
The Price and Marketing section columns are now reordered and renamed, showing always "Current Price", "Optimal Price" and "Explain" columns to assist first-time users.
Deprecated
-
Target Sales rules and KPIs have been removed from the front-end, as rules can now directly reference Liquidation End STR values, such as 'Liquidation End STR ≥ 80%'.
Fixed
-
Resolved an issue in histograms where values were mistakenly presented as NaN or zero instead of 'M'.
2025-11-04
Fixed
-
Fixed scopes with date filter.
2025-10-29
Added
-
Predicted Marketing Cost is now avaliable as a KPI in the preview curve
2025-10-23
Fixed
- A precision issue in floating point rounding that caused incorrect 'out of bounds' messages for profit weight during optimization has been corrected.
2025-10-22
Added
-
Users can now manually retry a failed pipeline run. If a pipeline has failed due to missing data or requires customer action, a rerun can be triggered from the pipeline status bar after the issue has been addressed.
2025-10-15
Added
-
Help desk tickets are now linked to the pipeline status sidebar and the changelog sidebar.
Fixed
-
The download of the optimization could encounter an issue.
2025-10-13
Fixed
-
Issues with creating, editing, and deleting upload schedules have been resolved.
2025-10-08
Added
-
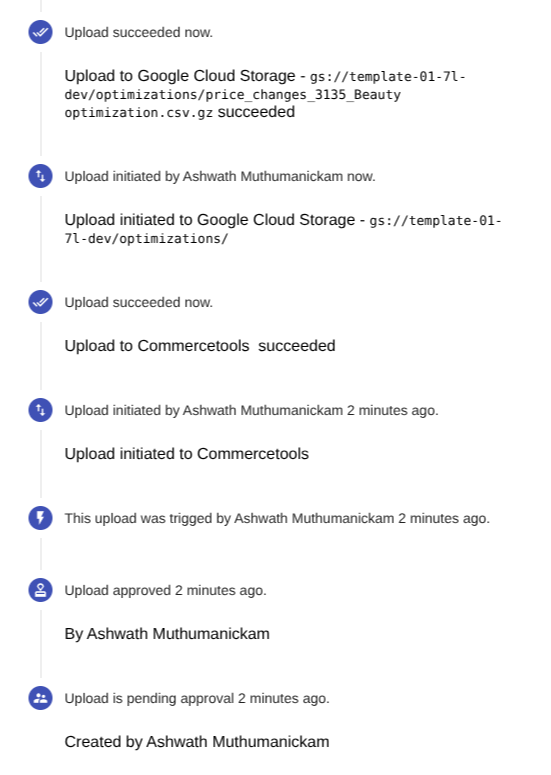
Users can now view the full file path for their uploaded files directly within the upload timeline.
2025-10-06
Fixed
- lockdown content security policy to angular
2025-10-01
Added
-
Commercetools Direct Price Synchronization A direct integration between 7Learnings and Commercetools is now available. This functionality enables the automatic transfer of optimized prices from 7Learnings, allowing for the immediate update of embedded prices within Commercetools without any manual intervention.
2025-09-25
Fixed
-
Fixed price-generating rules to prevent unintended selection of multiple marketing options in marketing optimizations.
2025-09-24
Fixed
-
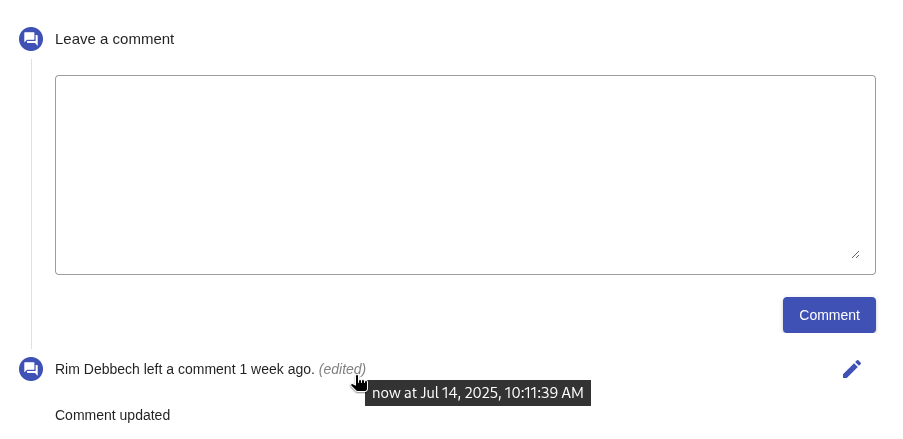
The '(edited)' label will no longer show on comments that have just been submitted.
2025-09-17
Fixed
-
Resolved an issue causing incorrect color display in histograms.
-
Improved formatting for values shown in rule names.
2025-09-11
Fixed
-
Upload to Shopify
2025-09-03
Fixed
-
Fixed "Rule depends on deleted scope" error not shown after scope was deleted.
-
Improved accuracy of optimization preview in case scope definitions split optimization groups.
2025-08-29
Fixed
-
Rework ineffective KPI from scope options.
-
Fixed incorrect wAvg Price Change displayed for "Do Nothing" scenario in optimization dashboard.
2025-08-28
Fixed
-
Improved app stability and overall experience.
2025-08-27
Added
-
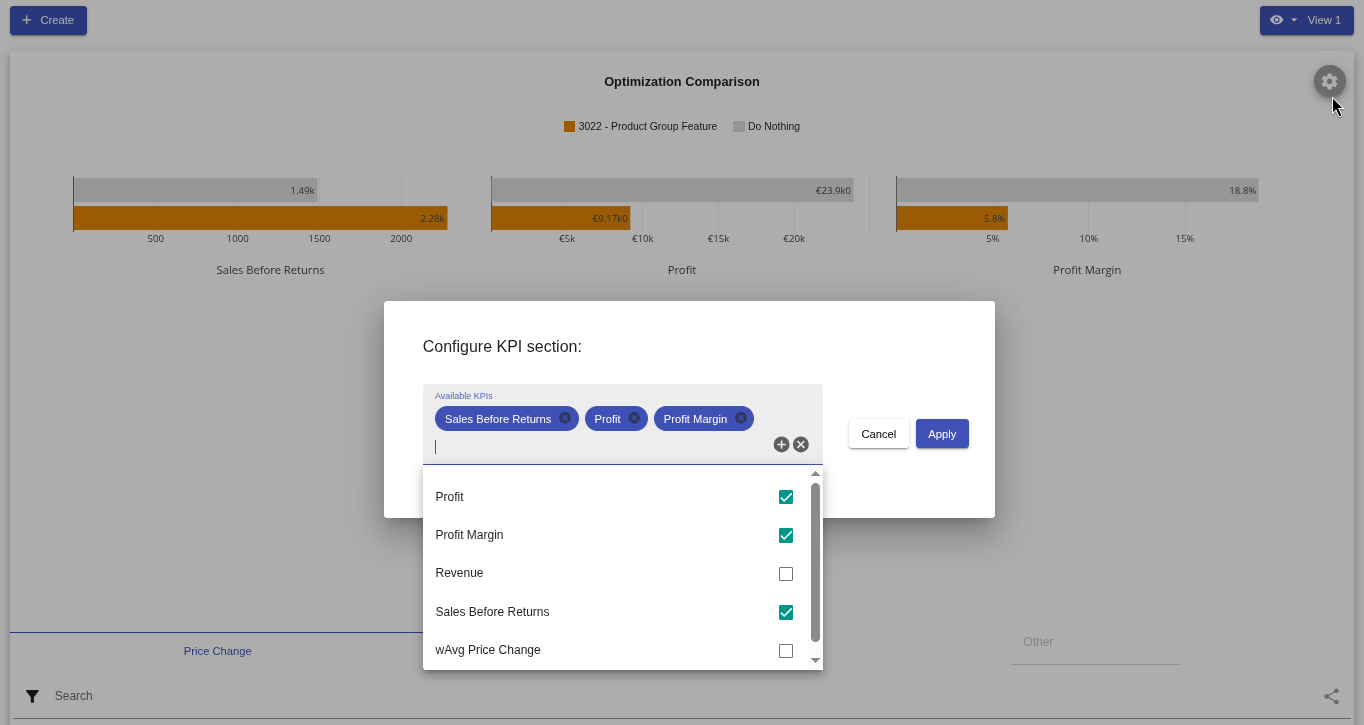
Choose which KPIs to display on the summary graph in the compare table.
Changed
-
Remove an ineffective KPI from the available scope options.
2025-08-21
Fixed
-
Resolved the problem with creating rule comments.
2025-08-20
Fixed
-
Resolved the problem where no optimizations could be created.
2025-08-20
Changed
-
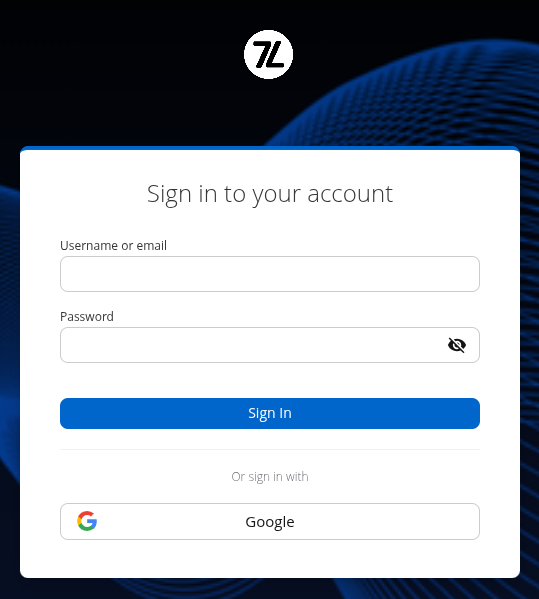
Redesigned the login interface for a more modern and intuitive experience.
2025-08-14
Fixed
-
Fix updating scope might lead 500 error.
2025-08-13
Added
-
It is now possible to group multiple rules together and rename these, making it significantly easier to create and manage complex optimizations involving numerous rules or scopes.
- Group Rules: Combine multiple rules into a single, manageable group to keep your workspace organized.
- Custom Naming: Rename rule groups for better clarity and quick identification of their purpose.
- Simplified Setup: Streamline the configuration of large-scale optimizations that span many rules or scopes.

Changed
-
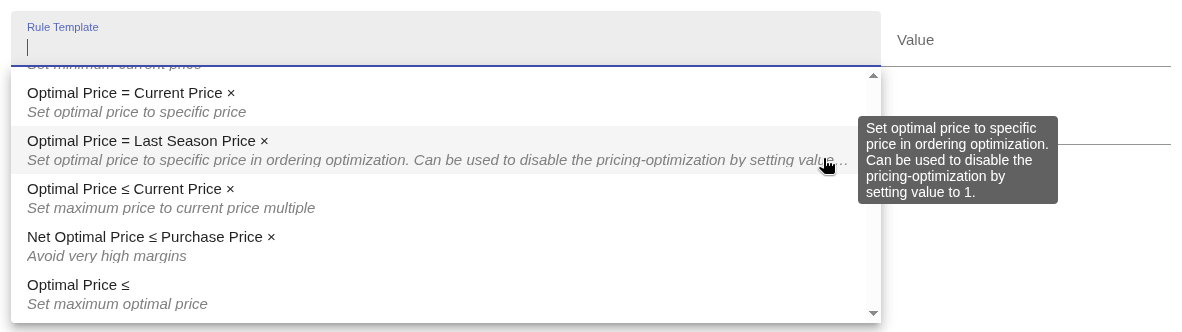
Hovering over a rule template, now shows its full description.
2025-08-12
Fixed
-
Minor tweaks and enhancements made.
2025-08-11
Changed
-
Improved the precision of your upload details.
2025-08-08
Fixed
-
Shopify bulk operations now accurately report status without misleading error messages.
2025-08-07
Added
-
Enhanced readability for quoted content within help desk ticket comments.

Changed
-
Login Interface got resdesigned.
-
Filters now consistently apply across all columns on every page.
2025-08-05
Fixed
-
Fix upload integration might fail with timezone casting error.
-
Fix downloading optimization might fail with snapshot optimizations_comparison view error.
2025-07-31
Fixed
-
Fix downloading newly added download format might fail.
2025-07-30
Fixed
-
Minor tweaks and enhancements made.
2025-07-23
Added
-
Timeline comments are now editable for every entity.
-
"STR at Liquidation End" KPI is now available in optimization preview.
-
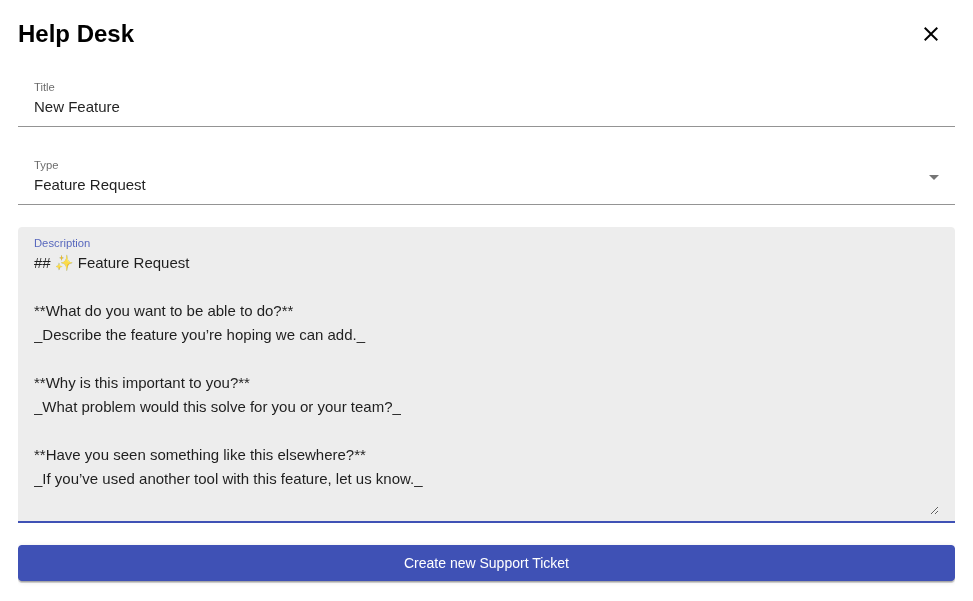
Add a help ticket template to enhance description quality.
-
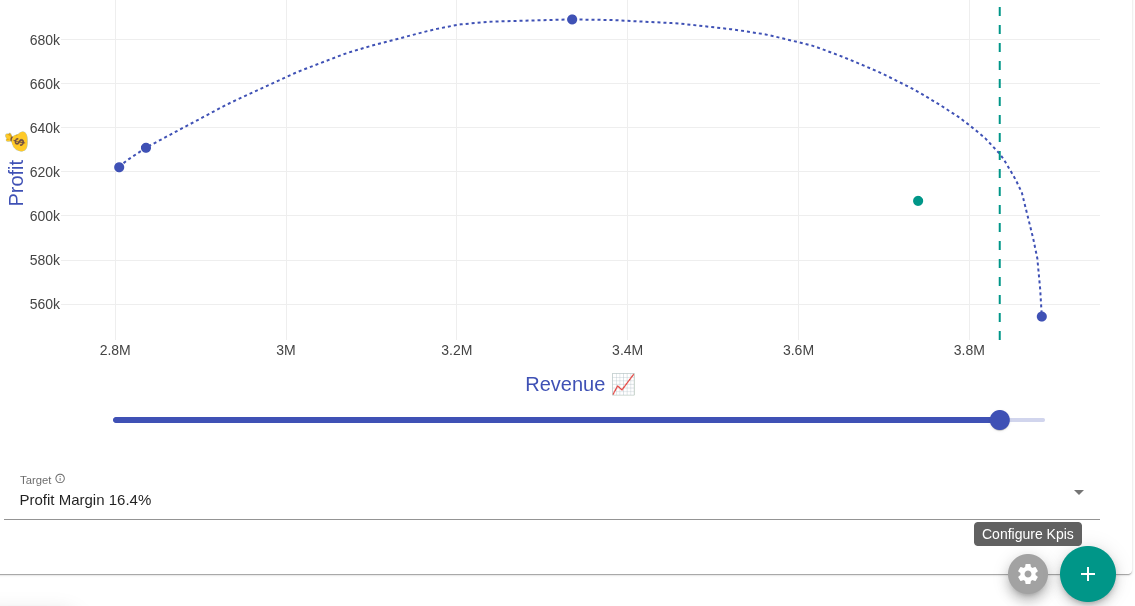
You can now see the predicted Liquidation End Profit on the preview curve when setting your targets. To configure the preview curve KPIs, please use the settings button below the curve.
Fixed
-
Ensured all help desk data is now fully visible and easy to read.
-
Expand and collapse rows to view more details about failed optimizations.
2025-07-16
Added
-
Enable comment editing in help desk section.
-
Hovering over chips in Explain Rule, now displays expanded information about rule status, including failure, out-of-scope, or single price selection reasons.
Fixed
-
Ensured rule chips always look right when you move them.
2025-07-07
Fixed
- Optimization Query Timeouts
2025-07-02
Fixed
-
Improve backend stability
2025-07-02
Changed
-
Increased optimizer efficiency.
2025-07-01
Fixed
-
Minor tweaks and enhancements made.
2025-06-30
Added
-
Get notified by email when your support request is answered.
2025-06-25
Fixed
-
Fixed Shopify upload behavior so uploads always complete in the background and you won't see incorrect error messages.
2025-06-20
Fixed
-
Fixed an issue that could cause uploads to get stuck.
2025-06-18
Changed
-
Removed redundant rule suffixes ('#n') from duplicated entries.
Fixed
-
Resolved: Users could encounter a 500 error when accessing the optimization dashboard.
2025-06-10
Fixed
-
Resolved an issue that stopped Tradebyte downloads.
2025-06-06
Fixed
-
Performance boost: Optimizer now supports more rules for larger optimizations.
2025-06-04
Fixed
-
Fixed an issue where optimization jobs might not start.
2025-05-27
Added
-
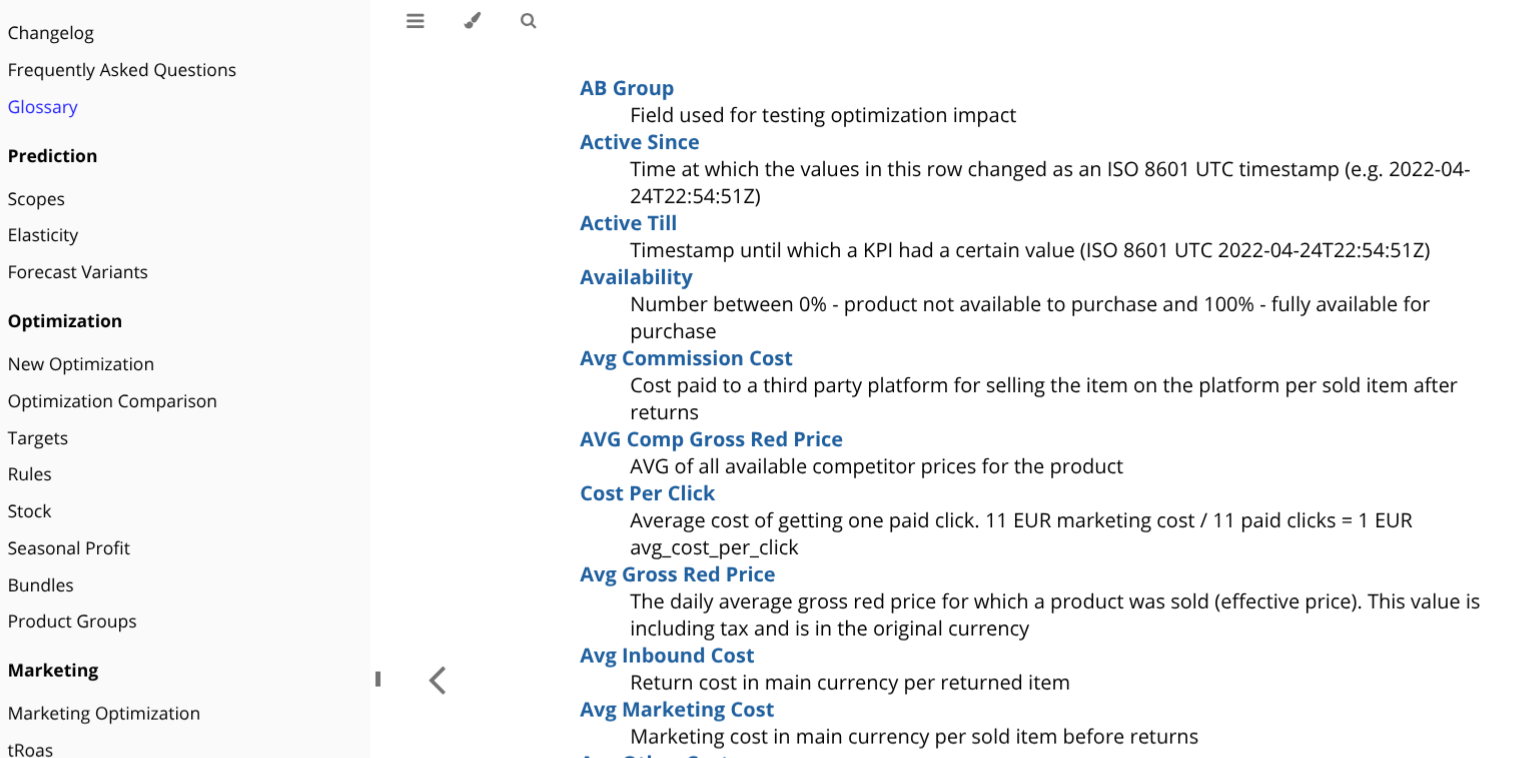
A Glossary section is now available in the help documentation, providing term definitions.
Fixed
-
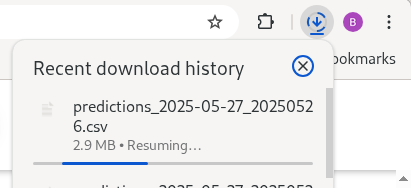
Improved download stability and added a progress indicator.
2025-05-22
Changed
-
Set the default visible height of timeline and help desk comment fields to 7 rows.

Fixed
-
Fix: Upload scheduling now correctly handles Sundays.
2025-05-06
Added
-
Enable rule editing within optimization creation flow.

-
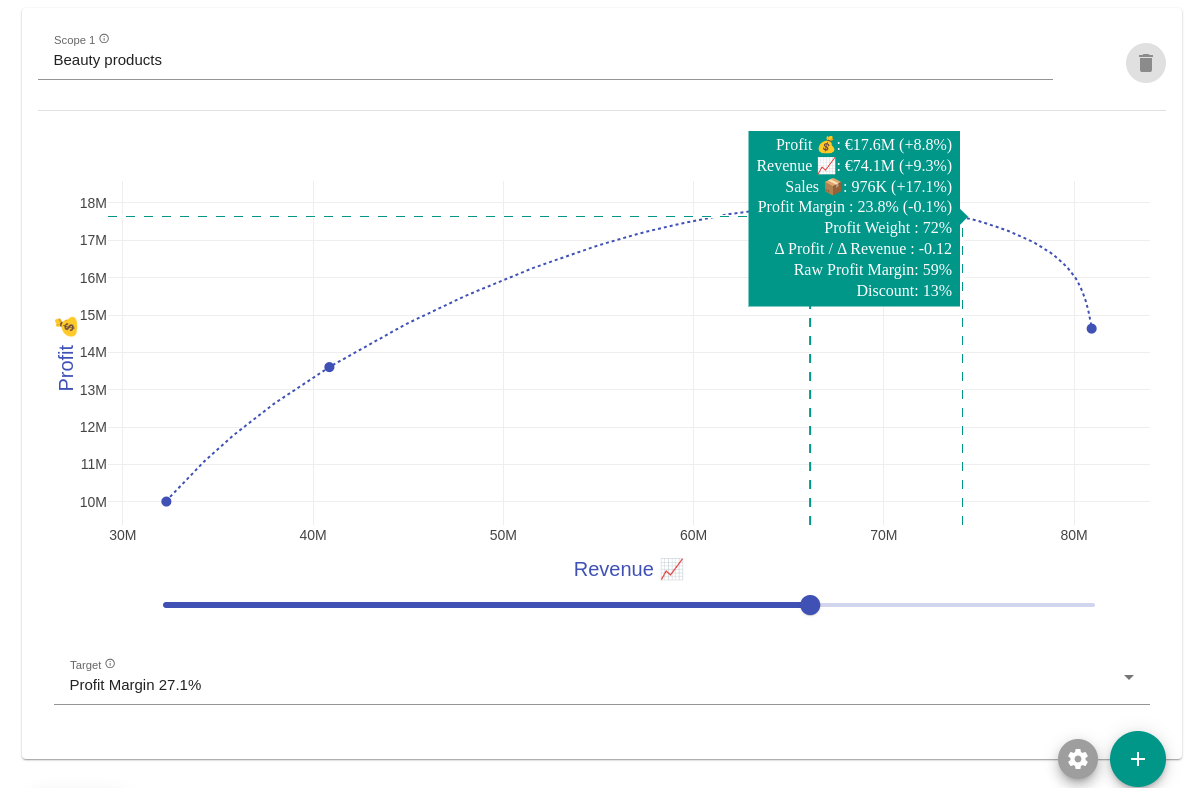
Preview curve now includes an optional Discount KPI; data scientist will need to enable it.
-
We added a new KPI called "KVI Rank". It's available in the Scope section, where you can create scopes for your most important products using the new KPI. By default, the ranking is based on historical revenue, the number of competitor prices and the historical product margin as KVIs are highly price-sensitive. Example: "KVI Rank < 100" will select your 100 most important products.
Changed
-
Improved rule explain: Expanded rule name area for better usability.
Fixed
-
Prevent overflow in rule explain section for failing rules.
-
More reliable uploads: Addressed problems with long running uploads.
2025-04-30
Added
-
Show rule IDs for easier rule identification.
-
Help Desk: Support "Question" ticket option.
Changed
-
Help Desk: Emphasis all links for easy navigation.
Fixed
-
Help Desk: Standardized bullet point list indentation.
2025-04-23
Changed
-
Subtle improvements and refinements applied.
2025-04-16
Added
-
Frontend support tickets with user comments are now live.

2025-04-09
Added
-
Improve the benchmark group feature in the new explain section.
Fixed
-
Use 'B' to represent billions on the axis label.
-
Resolved a problem where the optimization comparison view sometimes failed to open.
-
Fixed an issue that could change data types during optimization upload or download.
2025-03-28
Fixed
-
Resolved issue where comparison dashboard could show a 404 error.
2025-03-26
Added
-
We've added new optimization features and you can now directly send your optimized data to Snowflake!
Fixed
-
Fixed Minor issues with upload channel filter and veto functionality.
2025-03-24
Fixed
-
Display missing icon for benchmark groups.
2025-03-20
Fixed
-
Refined upload error handling for clarity.
2025-03-19
Added
-
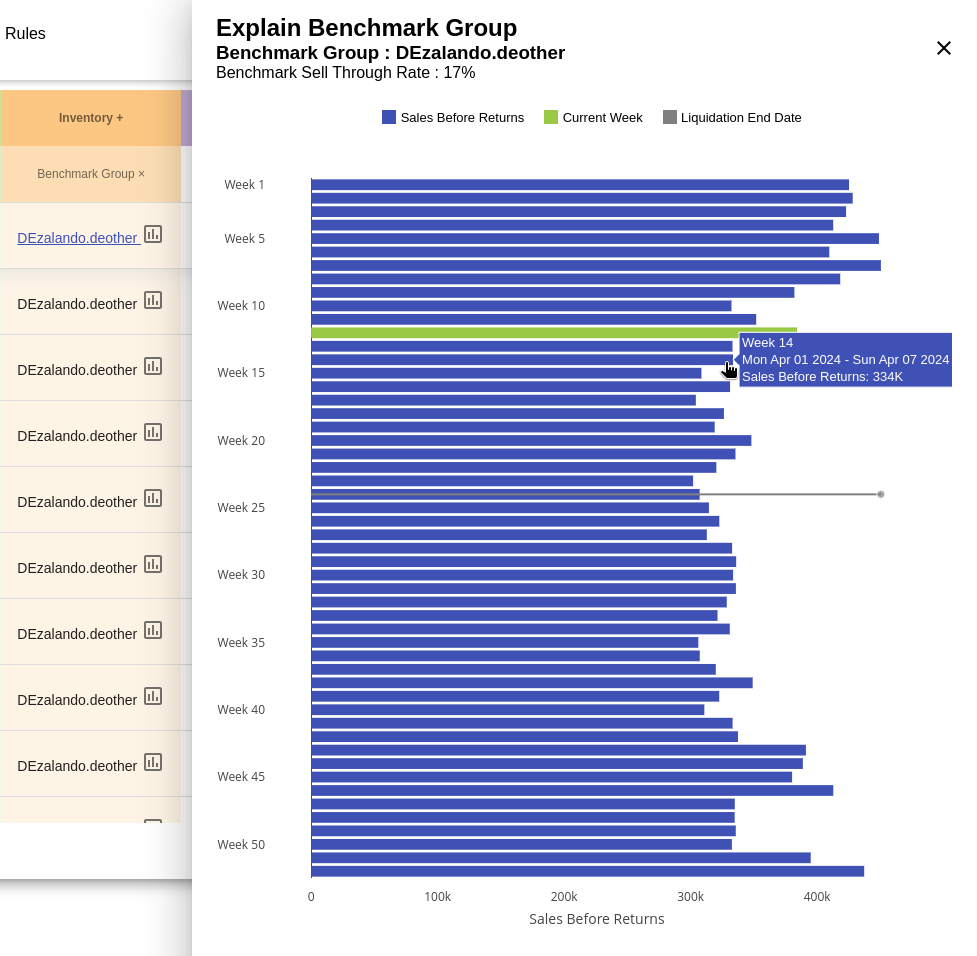
Introduced a new "Explain Benchmark Group" visualization, displaying weekly sales performance against a selectable benchmark group, highlighting the current week and liquidation end date on an interactive timeline.
Changed
-
Sharing just got easier! URLs now automatically include your active user group.
2025-03-14
Fixed
-
Resolved issue where filtering with true/false was not working correctly.
2025-03-12
Changed
-
Minor tweaks and enhancements made.
2025-03-06
Fixed
-
Editing a scope should now work correctly without server errors.
2025-03-05
Changed
-
Feedback Dialog: Closing the feedback dialog with the Escape key will now trigger a reminder next month, rather than upon the next optimization creation.
Fixed
-
Deletion Rule: Resolved an issue where fixing the deletion rule could trigger a server error.
2025-02-26
Added
-
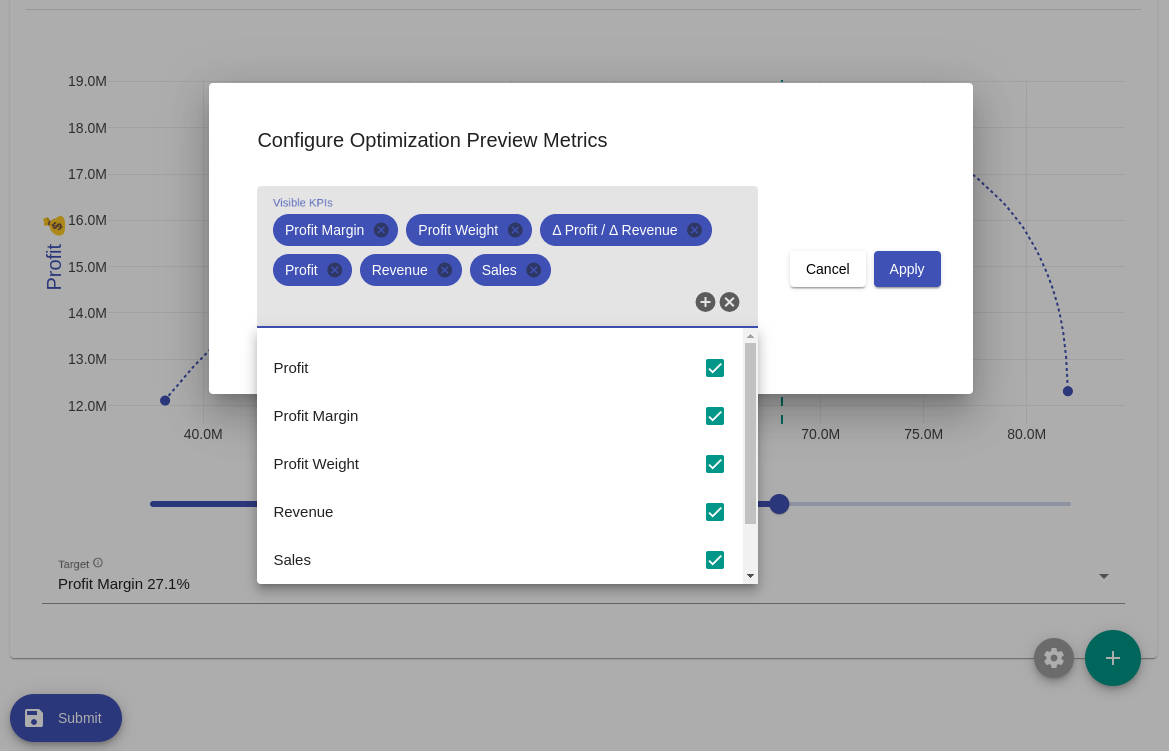
Made KPIs configurable in the Optimization Preview Curve.
Fixed
-
Fixed an issue where update scope could lead to "not found" error.
-
Fixed: Optimization previews now work reliably, even with complex scope definition.
2025-02-20
Fixed
-
Fixed an issue where update scope could lead to "not found" error.
2025-02-19
Fixed
-
Fix cropped dropdown in upload edit form.
2025-02-14
Fixed
-
Split CSV exports now correctly uses renamed column names.
2025-02-13
Added
-
Display recent pipeline status and the reason behind failure.
-
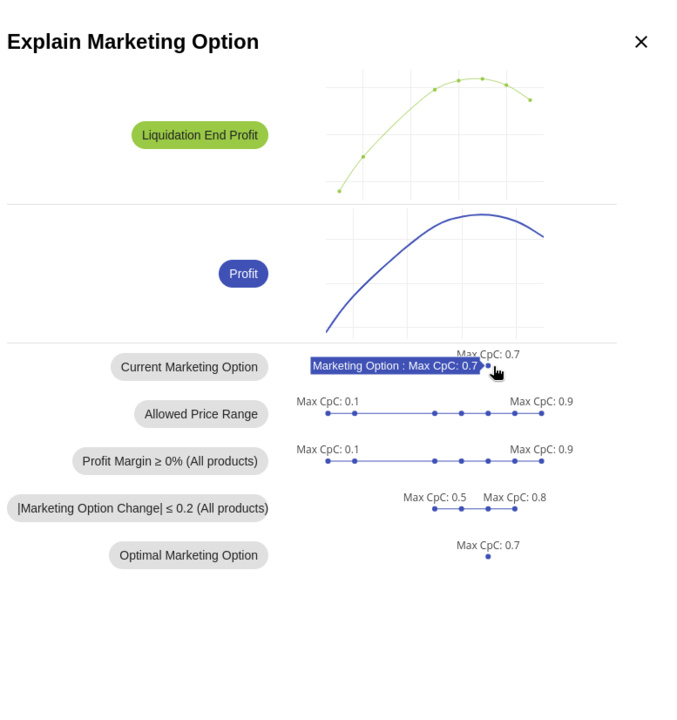
Add new widget to explain marketing decision. It contains the rules used and both profit and seaonal profit curves.
2025-02-10
Fixed
-
Optimization creation may fail due to invalid setup.
2025-02-06
Fixed
-
Resolved an issue where upload channel filtering could lead to upload failures.
-
Fixed an issue that could prevent optimization results from being uploaded to Google BigQuery.
2025-02-05
Added
-
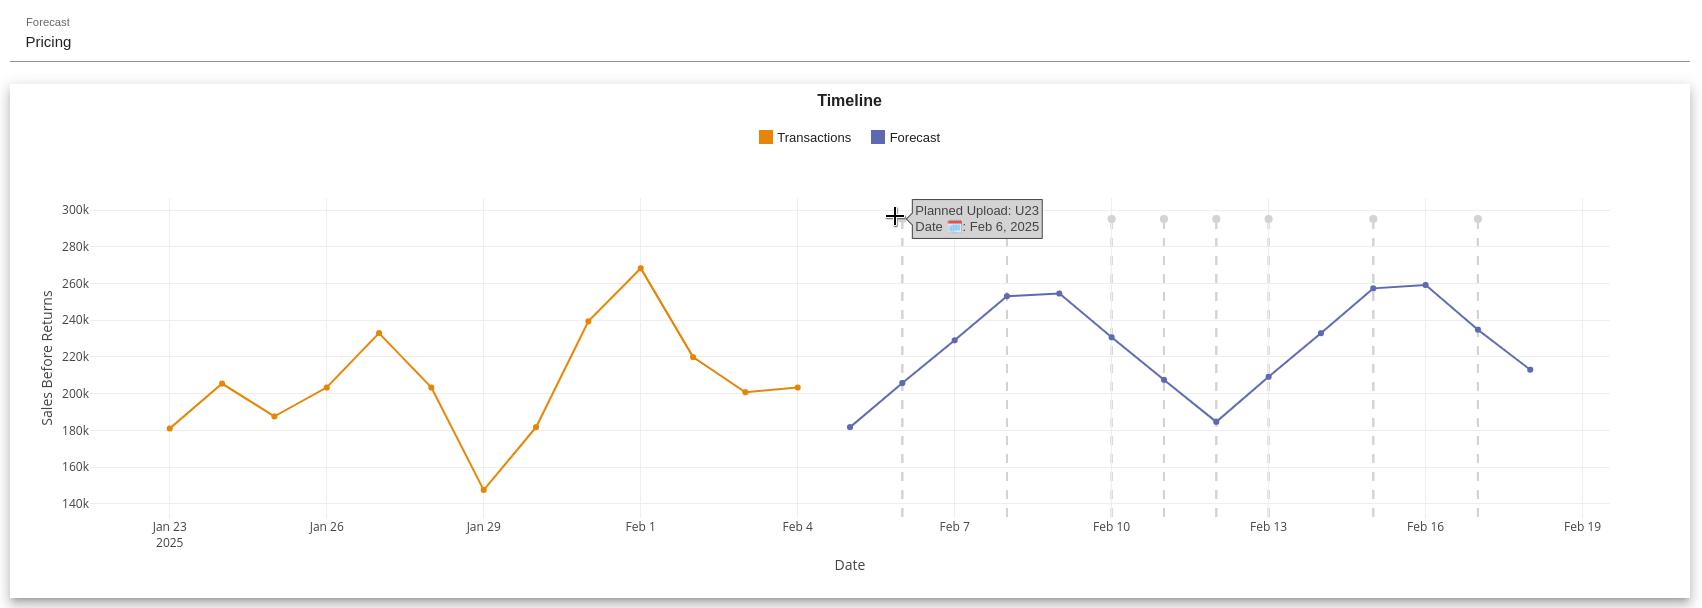
Display the upload information on hover in upload timeline.
Changed
-
Keep the feedback dialog open until feedabck is submitted.
2025-02-04
Fixed
-
Minor tweaks and enhancements made.
2025-01-22
Added
-
Add new help text of Product Group.
2025-01-20
Fixed
-
Resolved an issue where the Gross Red Price interpolation was incorrect when duplicate price points were present in the optimizer.
2025-01-17
Fixed
-
Fixed an issue where creating or editing a scheduled upload would fail.
2025-01-15
Added
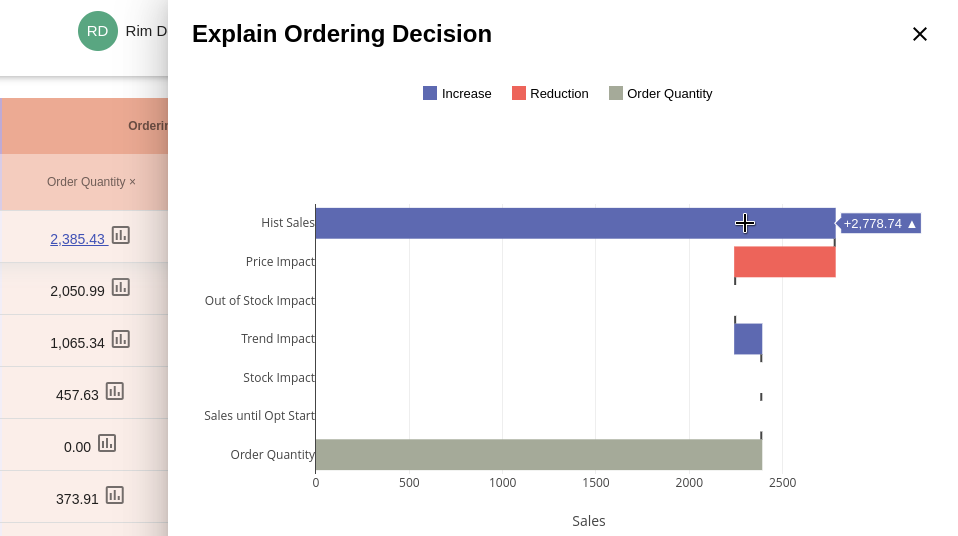
- Introducing transparent order optimization! Our enhanced comparison table now reveals the reasoning behind each recommended order quantity. See the key factors driving these calculations and understand exactly how our system optimizes your inventory levels.
2025-01-08
Changed
-
The column selection functionality of optimization comparsion table has been redesigned. Enabling the selection of multiple columns at once. Additionally the new design now supports autocompletion.

Fixed
-
Fixed incorrect steering target dial drawn for new optimizations.
2025-01-02
Added
-
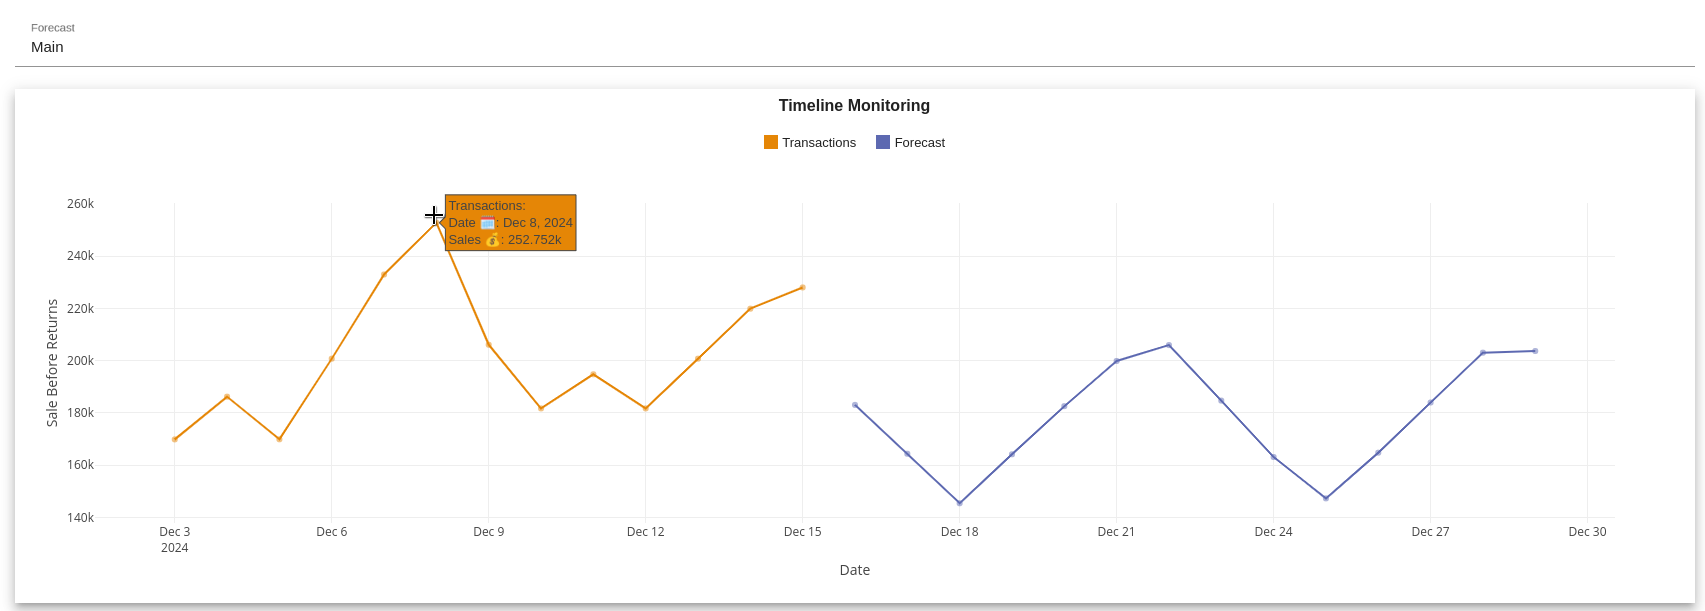
Add +-14 days dashboard to uploads for an overall predictions so that its easier to correctly schedule uploads.
2024-12-20
Fixed
-
Fixed a bug that caused errors during uploads to FTPS servers.
2024-12-19
Fixed
-
Allow KPI selection in the "Other" tab from the comparison table.
2024-12-18
Fixed
-
Minor tweaks and enhancements made.
2024-12-13
Fixed
-
Fix issue where upload page may stay in an infinite loading state.
2024-12-12
Added
-
Added explanatory text to the target section of optimization edit page for when current prices preview point is above the curve.
-
A new documentation section for Upload Channels is available.
-
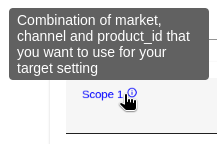
Help sections (Scopes, Rules, Forecast Variants) are linked to their respective fields on the Optimizations Edit page. Clicking a label or icon (e.g., Scope) opens the multi-section help sidebar, automatically focusing on the relevant section (e.g., Scopes).
-
Introduced a feature to view today's forecast status.
Fixed
-
Fix form reset issue when re-editing scope with in-progress count evaluation.
-
Fixed scope target being deselected if revenue slider is dragged all the way to the left when creating optimization.
2024-11-27
Fixed
-
Fixed smaller number of categorical values being displayed in histogram plot when viewing more than one optimization.
-
Fixed some rules that were incorrectly marked as incompatible with the forecast.
2024-11-20
Fixed
-
Fixed smaller number of categorical values being displayed in histogram plot when viewing more than one optimization.
2024-11-18
Fixed
-
Fixed some rules that were incorrectly marked as incompatible with the forecast.
2024-11-14
Fixed
-
Address the issue where the scope name is not correctly reflected in the download filename when the scope name includes umlauts.
2024-11-06
Changed
-
Show help section more clearly.
Fixed
-
Fix issue where split CSV downloads may produce empty results.
2024-10-30
Fixed
-
Fix misleading formatting for sales in preview curve on hover in optimization edit page.
2024-10-25
Fixed
-
Fixed an issue where a price-interpolating rule could violate optimization group consistency because of a missing value.
-
Fixed an issue where a rule could violate optimization group consistency, if rule's scope included only subset of products in optimization group.
-
Fixed inconsistent optimization groups could cause missing price selections in optimization result.
2024-10-25
Added
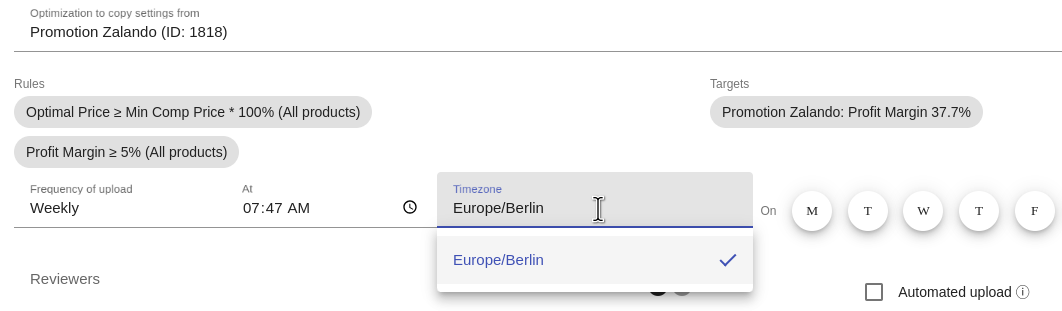
- You can now schedule uploads in specific timezones other than UTC.
2024-10-17
Fixed
-
Resolved an issue causing infinite page loading.
2024-10-17
Fixed
- Fixed usage of main forecast variant for all optimization comparison snapshots
2024-10-17
Fixed
-
Resolved an issue with optimization integration ignoring the delimiter.
2024-10-16
Fixed
-
Fix for unstable steering app (DB connection)
2024-10-16
Changed
-
Minor tweaks and enhancements made.
2024-10-11
Fixed
-
Fixed comments are not properly displayed.
2024-10-11
Fixed
- Hotfix for failing optimizations (PARSE_JSON)
2024-10-09
Added
-
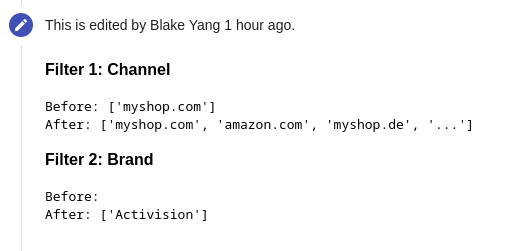
Display the specific changes made to the scope or rule during edit events, highlighting the differences between the original and updated configurations.
-
Added a new collection of frequently asked questions (FAQs) from users to enhance support and resource accessibility.
2024-10-02
Added
2024-09-25
Changed
- The From/Till column in Optimizations Table Overview now displays the creation date of the optimization instead. The optimization forecast range is still available via hovering over the creation date.
2024-09-18
Changed
-
Display profit margin for all points in optimization preview, even if Profit Margin target is not available.
2024-09-11
Added
-
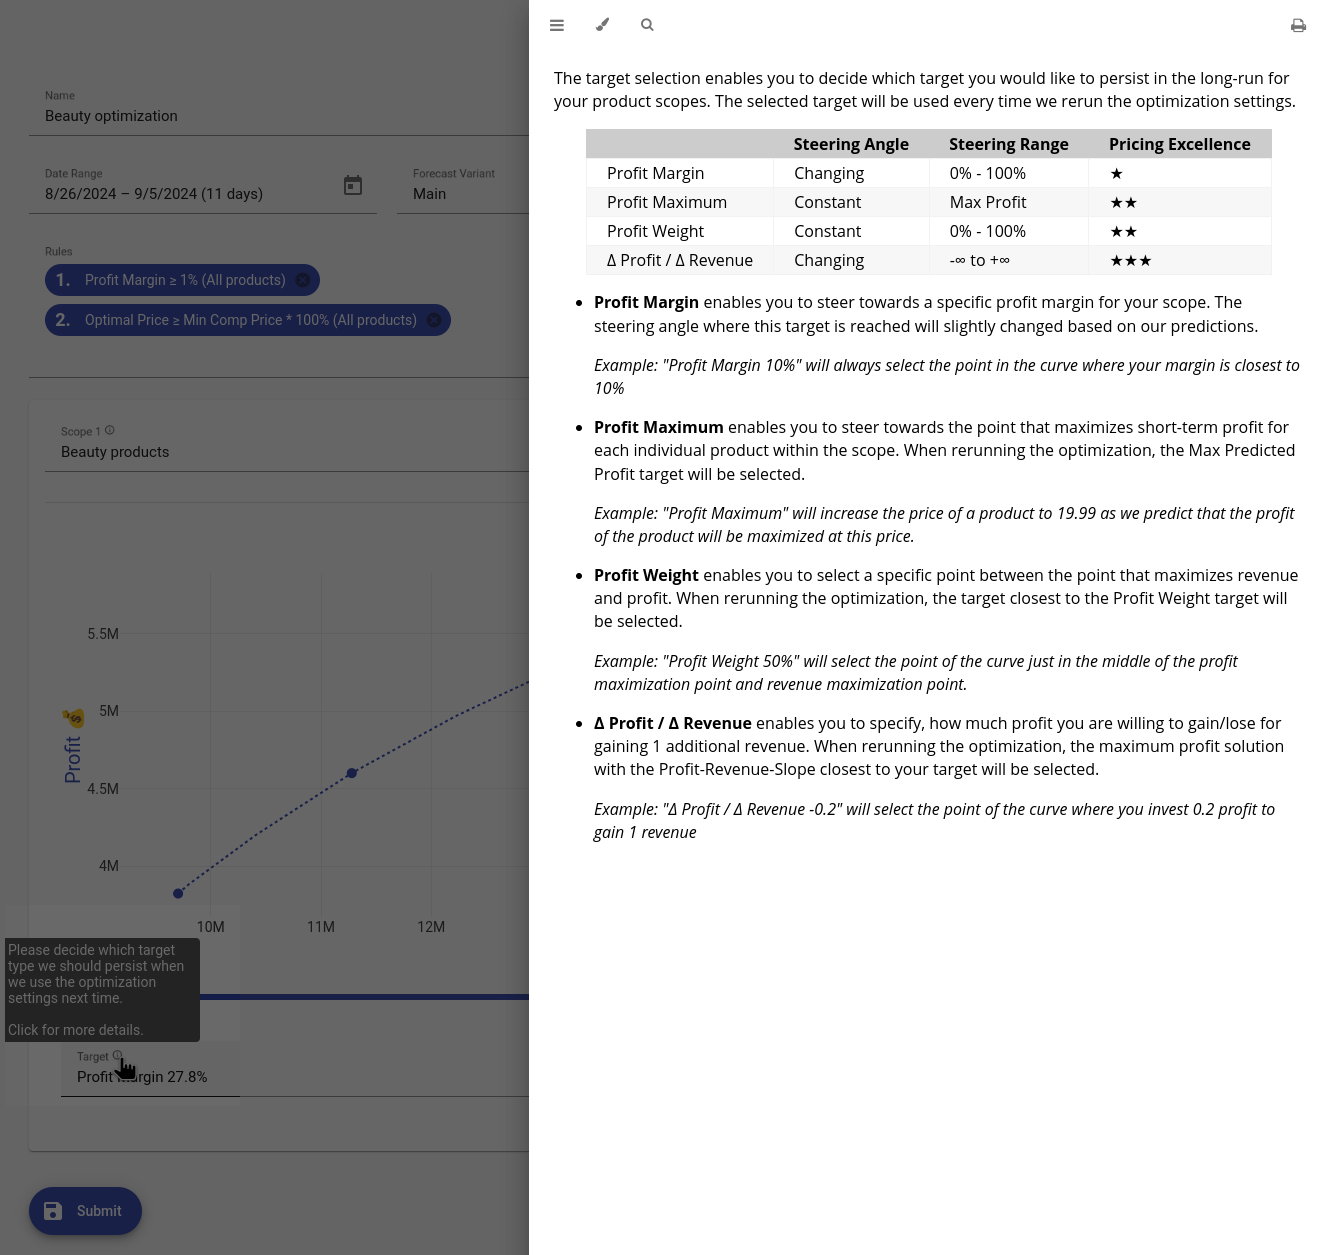
Expanded help text to provide more comprehensive guidance, starting with target selection in optimization edit page.
-
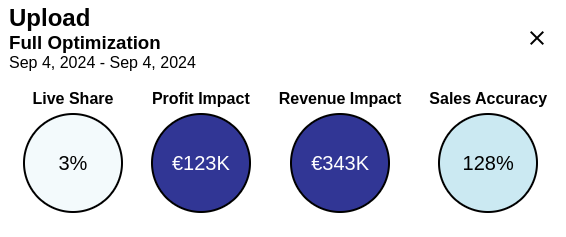
A new KPI; Revenue Impact. Has been added to the upload evaluation. This KPI provides a better notion of the trade-off between profit and revenue.
Changed
-
Added locale-aware number formatting for revenue, profit, and sales in hover on preview curves.
-
Enhanced table with a sticky header to keep column titles in view.
Fixed
-
Marked upload configuration fields as required.
2024-09-04
Changed
-
Enhanced Preview Performance
2024-08-30
Fixed
-
Resolved issue where scheduled uploads were not functioning correctly.
2024-08-29
Added
-
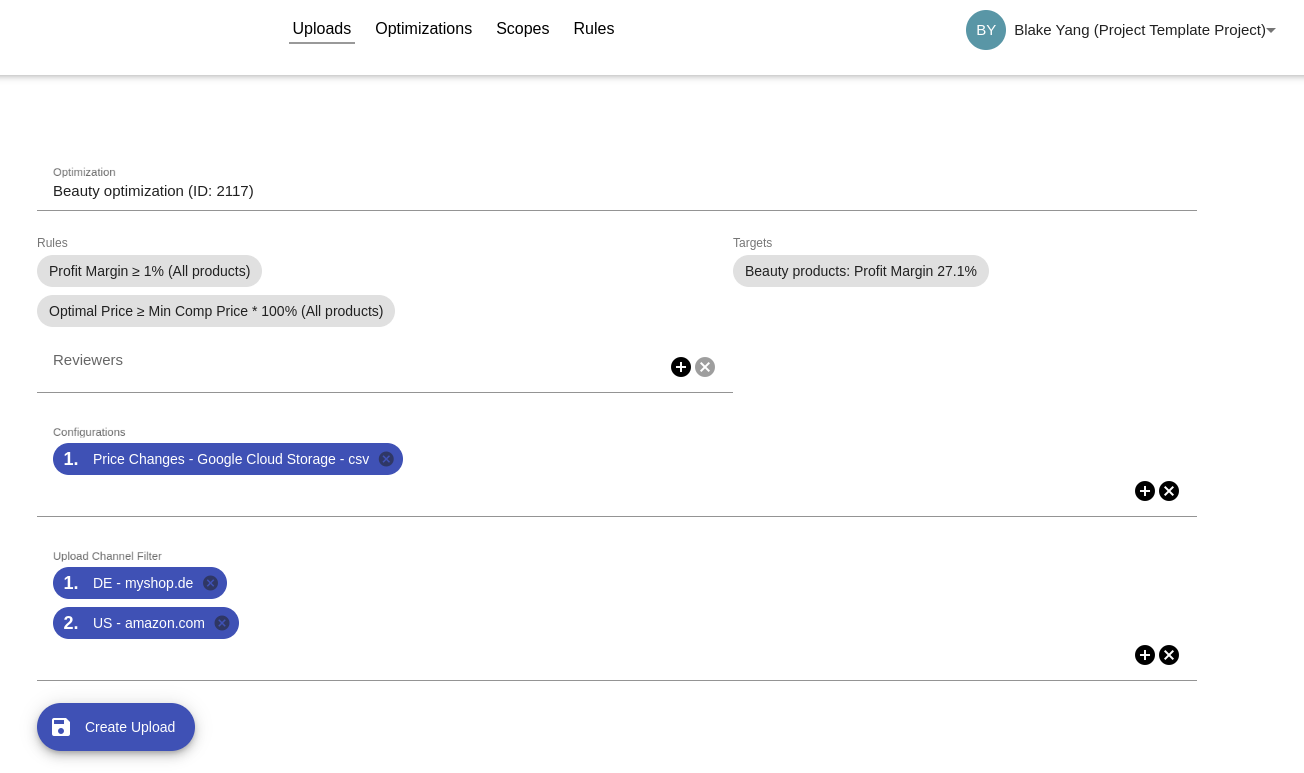
Added functionality to select specific markets/channels for price upload.
Fixed
-
Addressed issue where loading icon persisted without updating scope status or product count.
2024-08-21
Added
-
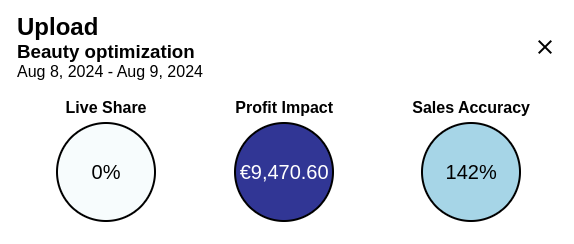
Display the start and end date below the optimization name in the timeline and add profit impact metric, to better evaluate upload performance.
Changed
-
Updated KPI names in all relevant tables and histograms to align with the defined ones.
Fixed
-
Fixed overestimation of current prices point when previewing optimization.
-
Resolve issue where scheduled uploads incorrectly display an error icon even after successful completion.
2024-08-15
Fixed
-
Use currency symbols based on market settings rather than relying on browser locale.
2024-08-14
Added
-
Re-added negative Profit Margin optimization targets.
Changed
-
Improved performance of optimization preview. Depending on optimization, reduced loading times by up to 40%.
-
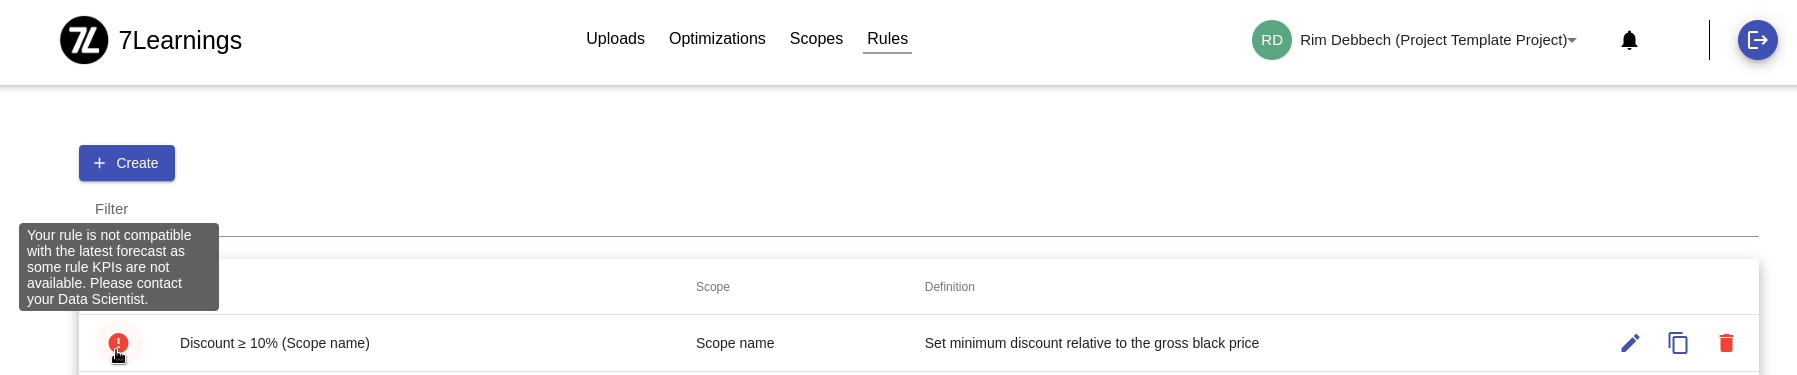
Relocate rule errors to the status column for improved clarity.
-
Relocate scope warnings to the status column and to timeline for improved clarity.

-
Make the comment field required when submitting a rating for the optimization creation experience.
Fixed
-
Use the correct local currency for Switzerland.
2024-08-07
Changed
-
Minor tweaks and enhancements made.
2024-08-01
Fixed
-
Fixed issue with optimization preview not loading due to sampling of duplicate points on rare occasions.
2024-07-31
Changed
-
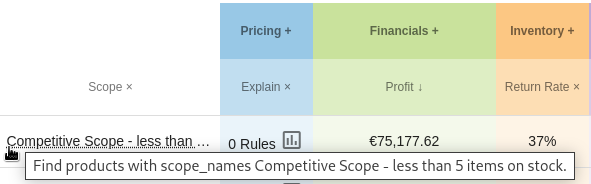
Set a max width for scope column and truncate long names in optimizations view to prevent blocking other KPIs.
Fixed
-
Fix incorrect steering dial displayed for first target of a multi-target optimization.
2024-07-25
Fixed
-
Resolve issue where automated upload may run multiple times.
2024-07-24
Added
-
Display the number of days in the date range input when creating optimizations.
Changed
-
Improved pop-up notifications for forecast and optimization date range applications.
-
Introduced the capability to display images within the changelog, enhancing visual communication of updates.
-
Clicking on date icon will open calendar instead of setting values to present range.
-
Renamed Seasonal Profit to Liquidation End Profit as this profit refers to the total profit at Liquidation End date (including write downs).
2024-07-17
Added
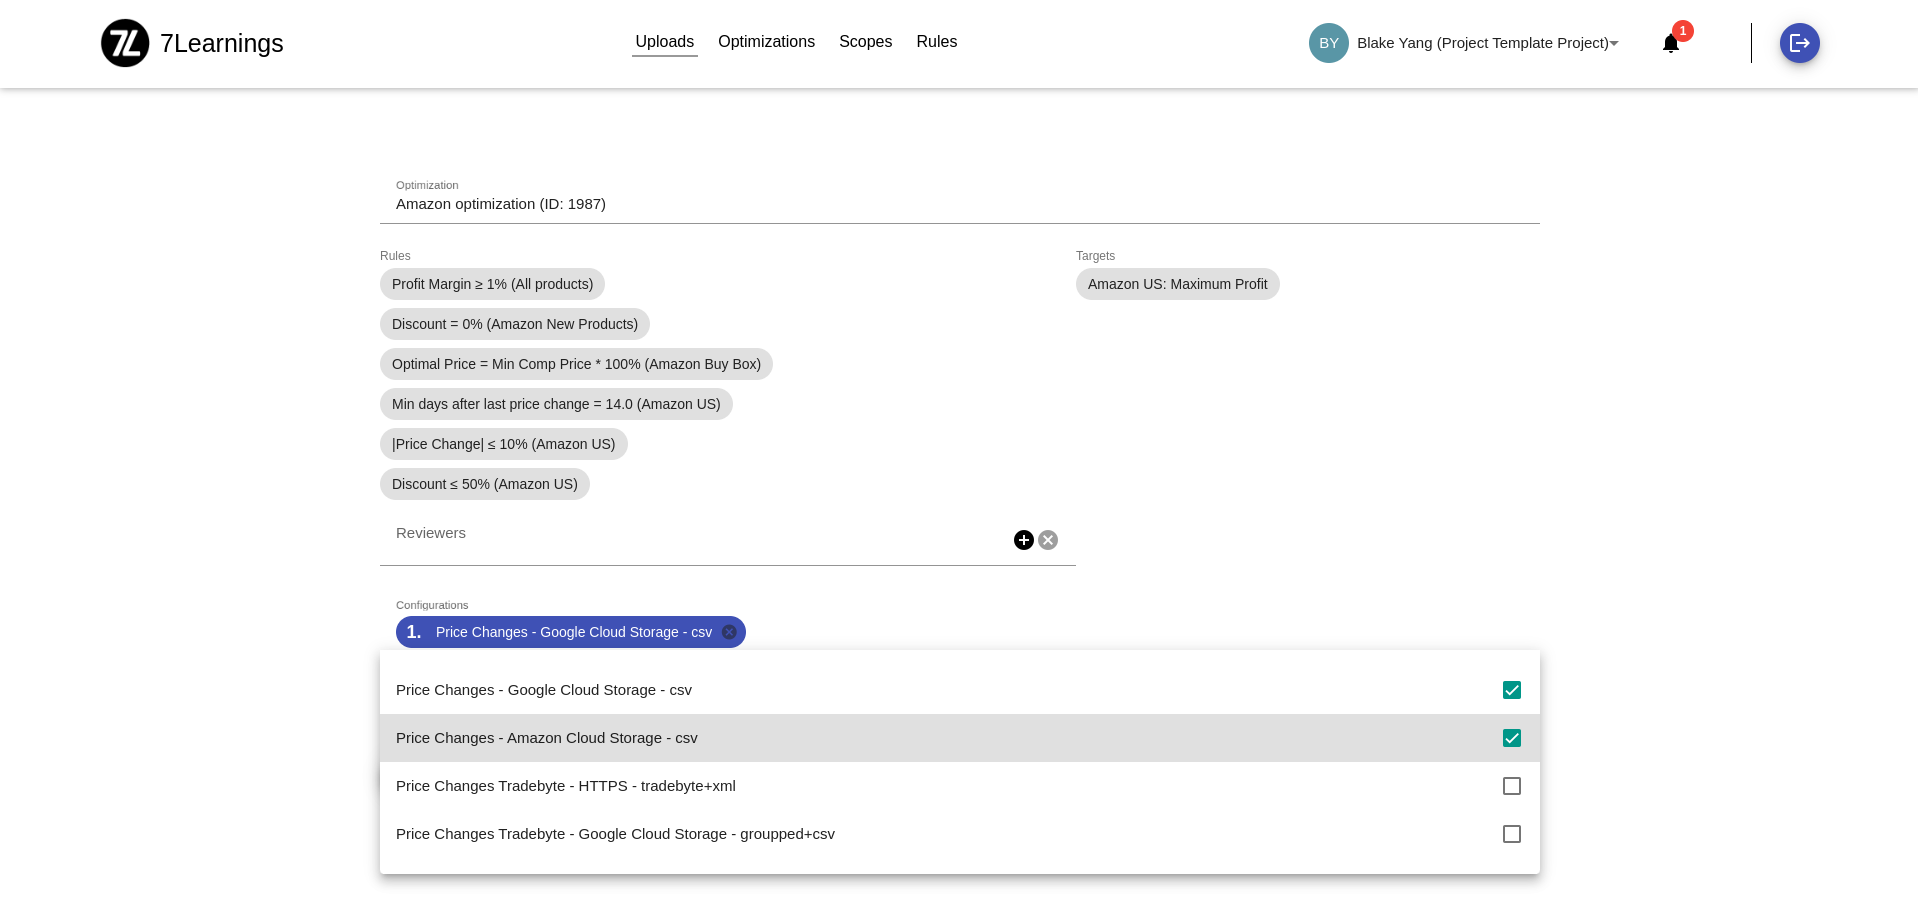
- When creating an optimization upload, it is now possible to select multiple integration destinations for the same optimization simultaneously.
Changed
- The competitor price plot was improved and prices are now easier to distinguish.
- The optimization preview curve now fully extends to the left of the Maximum Margin Point until the Minimum Revenue Point.
2024-07-10
Changed
- Disabled edit icon for failed uploads.
- Improve Profit Weight Target by rounding to full percentage targets e.g. 24% instead of 24.1%
Fixed
- Enhanced number formatting to be locale-aware for consistent decimal display.
2024-07-03
Changed
- The target selection slider in the optimization preview curve, now shows the actual value while dragging. Allowing for a more precise selection of the selected target.
- Price history plots layout is now more readable.
Fixed
- Resolved scope filter reset issue during multi-scope edits.
2024-06-26
Fixed
- Fix overlapping x-axis ticks in price history plots.
2024-06-25
Fixed
- Resolve the issue of previous uploads disappearing.
2024-06-24
Fixed
- Ensure scope count updates correctly.
2024-06-19
Added
- Added new target type: Δ Profit / Δ Revenue, that lets you steer prices towards particular Profit-Revenue slope.
Changed
- Enhanced plot clarity by adjusting legend position and default selection.
2024-06-14
Fixed
- Fixed display for price history plots not being correctly sorted.
2024-06-12
Fixed
- Fixed two identical rows appearing on rare occasion when creating a new upload.
- Fixed 0 is not recognized as a valid value when editing scope.
2024-06-05
Changed
- When copying an optimization, to avoid manual edits, the end date is now limited to the forecast end date if the copied optimization period is longer. If there is no valid forecast for today, the date range selection will be cleared.
- Selection of negative Profit Margin targets is not allowed anymore. Instead, optimizations should be steered using the Profit Weight target type.
- Updated feedback prompt to appear only if more than a month has passed since the previous one.
- Moved the prompt to the bottom center to prevent it to obscure the timeline and enhance the overall layout.
- The scheduled upload will now proceed only if there is a new forecast.
2024-05-30
Added
- Implemented new page for creating and editing uploads, replacing inline edit in table.
Fixed
- Display correct KPI names in scopes table.
2024-05-24
2024-05-22
Added
- Improved the upload page to display timestamps with UTC hours and minutes, providing clear time zone information for when optimizations were uploaded relative to Coordinated Universal Time.
- Display Δ Profit/ Δ Revenue in preview curve hover to prepare as new target type
Changed
- Changelog moved to sidebar dialog for better visibility, ensuring consistency and maximizing space.
- Reversed fields order in optimization edit page for better intuitiveness: preview first, then target selection.
- Enhanced optimization display during runtime to show an empty product count instead of indicating 0.
2024-05-08
2024-04-30
2024-04-26
Added
- Added new optimization target type: Profit Weight
- Display tooltip descriptions of target types in select box when creating optimization.
Changed
- Filtering by price KPI's in the comparison dashboard is now easier. A clickable icon now gives access to the sidebar and restores the text-click functionality for filtering.
- The search term dialog in the optimization comparison dashboard is now always centrally positioned for complete display.
- Placement of cancel/submit buttons to the right of the search term dialog was adjusted, to avoid overlap with select options.
Fixed
- Currency information is now more accurate and up-to-date.
- Clicking on list of scopes in optimization dashboard will now search for products belonging to every scope in the list.
2024-04-19
Fixed
- Resolved potential login failure for email authentication.
2024-04-17
Added
- The Identifiers section of the comparison table is now customizable, enabling users to effortlessly add or remove columns based on their preferences.
- The comparison dashboard can now be filtered via the scope names in the optimization. This way is possible to view products belonging to a certain scope only.
Changed
- Enhanced functionality to allow editing configurations for pending uploads.
- In addition to uploading an optimization immediately, now is possible to create an upload instance of the selected optimization in the upload section to be uploaded later on.
2024-04-09
Added
- It's possible now to edit the name of optimizations after they have been created.
Changed
- The 'Create' and 'View' buttons have been relocated to the top of the Optimization Comparison interface.
Fixed
- The spinner has been fixed and is shown during the re-evaluation process.
- Addressed the issue to ensure that edit events are now properly shown within the scope timeline.
- Implemented a fix to enable users to empty reviewers successfully during the editing process.
2024-04-02
Fixed
- Ensure that scopes undergoing evaluation are not utilized in the optimization process.
2024-03-28
Fixed
- scope creation with huge filter lists
2024-03-27
2024-03-20
Added
- Users with upload permissions can now activate the auto-upload functionality by selecting the option for automated upload.
Changed
- Introducing progress spinner for scopes under evaluation, streamlining initialization wait times.
- Introducing multi-line functionality in the rule template dropdown, enhancing visibility for easier selection.
Fixed
- Addressed the problem of predicted values not being vertically aligned in the optimizations table.
2024-03-12
Fixed
- Fix issue downloading scopes for user group
2024-03-12
Added
- Allow to select exact search value in forms that support it.
Fixed
- Fix autocomplete input persisting only up to 100 values.
2024-03-07
Fixed
- Fix scheduled upload doesn't preserve steering target
2024-03-06
Added
- When creating an optimization, a target type can be chosen for the selected point in the preview graph, enabling more precise optimization goals.
- A new Maximum Profit target type is introduced for preview points, allowing optimization for maximum profit potential.
- Hovering over a rule in the Explain Price Decision tab of the optimization dashboard now reveals the full rule name, offering greater transparency into pricing decisions.
Changed
- Copying an optimization now includes the original targets, not just the final optimization result, ensuring the initial configuration is preserved and facilitating re-running the optimization with different settings.
2024-03-01
Added
- Users without upload permissions, are now able to review or/and approve/upload optimizations
- Adding support for markdown comments
Fixed
- Adding support for special characters in comments. e.g. apostrophes.
- Fix can't edit uploads unless they are in the first page.
2024-02-28
Fixed
- Fix upload to Google storage bucket might fail
2024-02-20
Fixed
- Fix optimization status not detected correctly because of comments posted while optimization was still running.
2024-02-19
Added
- Display price history graph for selected column on top of other graphs in optimization comparison dashboard.
- Scopes, rules, optimizations, and uploads now all have sharable links to their timelines.
- Automatically open timeline of newly created upload, optimization, scope, or rule.
- Paginate and scroll into view if selected instance is not visible.
Fixed
- Fix unable to edit in-progress upload.
2024-02-07
Changed
- Make all rules available for selection when creating optimization. Highlight and display error for invalid rules.
Fixed
- Fixed date range change triggered reset of targets to current prices revenue when creating optimization.
- Improved precision of optimizations with respect to given profit margin targets.
- Fixed incorrectly inferred types of column when editing a scope filter.
- Fixed unable to create scope with timestamp filter.
- Fixed histogram in optimization dashboard sometimes displaying more x-axis ticks than necessary.
2024-01-31
Changed
- Redesigned upload scheduling, with a cleaner and more intuitive UI.
Fixed
- Allowing selection of boolean and empty values in scope creation
- Implement text truncation with ellipsis for better overflow handling in search values.
2024-01-24
Fixed
- Improve response time when creating/editing a scope
2024-01-16
Added
- Enabling advanced search for categorical KPIs, via OR operator.
- Add option for Daily repetition of scheduled uploads.
Changed
- Enabling sorting rule definitions by name.
Fixed
- Unable to handle TIMESTAMP datatype while creating a scope
2024-01-09
Added
- Display rule definitions in "Rules" page.
- Display rule fallback when hovering over rule definition.
Changed
- Allow interaction with search bar while optimization dashboard is loading.
Fixed
- Remove histogram column from tabs when it is not available for the selected optimization.
- Fix division by zero error in preview graph.
- When creating optimization, fixed 'End Date' sometimes being updated to most recent date, overriding user input.
2024-01-05
Fixed
- When creating optimization, fixed 'End Date' sometimes being updated to most recent date, overriding user input.
2023-12-28
Added
- Added "Share Search Results" button in search bar of optimization dashboard.
- Added search for vetoed products in optimization dashboard.
Changed
- Separated Profit and Seasonal Profit plots in Explain tab of optimization dashboard.
Fixed
- Fixed overflow of long comments in timeline.
2023-12-22
Fixed
- Unable to download prices
2023-12-21
2023-12-21
Fixed
- fixed updating and downloading scopes
2023-12-21
Fixed
- Fix upload scheduling execution
2023-12-20
Added
- Display optimization accuracy metrics in timeline.
- Add caching technology to the front-end to make the preview of previously optimized product scopes faster. The second optimization with the same optimization scope should now be much faster.
Changed
- Enable search by failing or passing rules in optimization comparison dashboard.
2023-12-13
2023-12-05
Changed
- Enhance user profile aesthetics by implementing initials as the icon.
- Add ellipses for long names, enhancing readability.
2023-11-30
Added
- Support Tradebyte Pricing API. Optimizations can now be uploaded directly to TBOne system
Changed
- Use up-to-date rule definitions when copying older optimizations, instead of showing an error for outdated ones.
2023-11-27
Fixed
- Fix not being able to upload/download CSV integrations.
2023-11-23
Added
- Introducing selection of reviewers for Pending Uploads.
Fixed
- Fix rule selection not available when trying to edit selected rules in optimization dashboard's search bar.
- Do not redirect to Uploads page when downloading an optimization.
- Support scope filter with much bigger number of specific values.
2023-11-15
Changed
- Preserve optimization date range length when copying.
Fixed
- Restrict user selections to a 14-day range for optimization date range.
2023-11-07
Added
- Introduce expand icon to toggle visibility of multiple targets in optimizations page.
Changed
- The veto list is persistently stored when creating or approving uploads.
Fixed
- Fix error message after optimization was pinned.
2023-10-27
Added
- Add paginator to opimizations page to simplify the table.
- Add paginator uploads page to simplify the table.
Changed
- ##20200 - Improved file organization by renaming internal filenames in the downloaded zip with a prefix of the zip filename, enhancing clarity and consistency. Previously, internal filenames contained only the tradebyte channel key.
Fixed
- Change to corresponding group automatically after reviewing an upload.
- Fix compare dashboard crashes when all rows are filtered out.
2023-10-20
Added
- Enable multiple weekdays selection for weekly uploads.
Changed
- Switch display from creation date to edit date for forecast's last data update in optimization creation page.
- Group histogram outliers in compare dashboard.
2023-10-04
Added
- Support Portuguese locale.
Changed
- Enable hover info between available points in price history graph.
Fixed
- Fix the link/button in mail not showing in some cases.
2023-09-28
Fixed
- false positive rule incompatibility error
- Fix a problem with an empty row sometimes appearing after creating a scheduled upload.
2023-09-21
Added
- Show date of last update for selected forecast when creating optimization.
- Display errors if rules are not compatible with the selected forecast in optimization creation.
- Schedule a weekly price update in upload page.
- Enable deletion for pending uploads.
Changed
- Display status icon for pending uploads.
- Sort kpis columns alphabetically in compare table.
Fixed
- Highlight empty value fields when submitting a Scope.
- Display time in upload table in user local timezone.
2023-09-12
Added
- Support interpolating rule prices from product attributes
- Support Danish locale
Fixed
- Fix approve/upload in upload page.
2023-08-29
Fixed
- Fix welcome message shown on every page reload.
2023-08-25
Changed
- Updated to Angular 14.
Fixed
- Speed up creation of scopes based on attributes with large number of unique values. Values for such attributes will no longer be validated.
- Greet user once for the same session.
2023-08-08
Fixed
- Fix overlapping prices on Y-axis in price history view of optimization comparison table.
2023-08-03
2023-07-27
Added
- More competitor price graphs are now available in price history panel of optimization comparison table.
Fixed
- Fixed missing competitor prices in rule explanation panel of optimization comparison table.
2023-07-22
Fixed
- Fix unable to download the optimization.
2023-07-20
Added
- Enable switching optimizations of uploads
Fixed
- Fix parsing of numerical values when editing search terms in optimizations compare table for some locales.
- Update the upload page instantly after adding an upload.
- Handle over-sized product filters
2023-07-19
2023-07-18
2023-07-17
Added
- Display the destination of the upload.
- Examples of products are now available when hovering over a detected scope intersection while creating an optimization.
Changed
- Improve login screen layout.
2023-07-05
Added
- Add ability to comment when reviewing an upload.
Fixed
- Fixed backend error on change of filter operator when creating a scope.
- Missing values will now be considered false in boolean scope filters.
2023-06-28
Added
- New uploads will now include "Content" column.
- If available, exact time of price change will now be displayed in price history view of optimization comparison table.
Fixed
- Fixed upload status having incorrect icon sometimes.
2023-06-20
Added
- If available, add seasonal profit graph to "Explain" column of optimization comparison table.
- Added new explain tag containing number of products in optimization group. This tag lets you know if product's pricing can be influenced by other products within its optimization group.
Changed
- Improved explain tags in optimization comparison table. Now they contain objective numerical values, and are color-coded according to their impact.
Fixed
- Fixed search in compare table if column is missing for one of selected optimizations.
2023-06-16
Fixed
- Fixed search in compare table if column is missing for one of selected optimizations.
2023-06-15
Fixed
- Preserve comments indentation in timeline.
2023-06-12
Fixed
- Fixed issue where optimization was not automatically uploaded after user with upload permissions clicked on the upload button.
2023-06-07
Added
-
Id of the selected upload is stored in the address of the tool website. This link can be shared and it will redirect to the compare table of the selected optimization.
-
In the upload section, users with permissions can approve/upload pending optimizations using the upload button.
-
Ids of the selected optimizations is stored in the address of the tool website. This link can be shared and it will redirect to the compare table of the selected optimizations.
Changed
-
Enable pushing optimizations to upload section for users without upload permission. Optimizations will be pending for approval in the upload section.
-
In the compare table, for Explain and price columns, you can now click on the item to see a separate pop-up for rules explanation and price history information.
Fixed
- Individual product prices are no longer affected by overlapping scopes.
2023-05-24
Added
- Detect and inform about scope overlaps when creating optimization.
2023-05-19
Added
- Show price history in compare table.
2023-05-12
Added
- Disable submit button when creating optimization with multiple targets for the same scope.
- Enable optimization view from upload section.
- Enable comments on uploads.
2023-05-02
Added
- Add 'Uploads' section.
Changed
- Improved accuracy of preview curve when creating optimization.
Fixed
- Prevent price labels from overlapping on small ranges in rule explanation column of optimization comparison table.
- Fix unable to search boolean columns in optimization comparison table.
2023-04-25
Fixed
- Unable to upload optimization
2023-04-19
Added
- Display separate allowed prices for each rule in Explain column of optimization comparison table.
Changed
- Increased width of histogram search dropdown in optimization comparison.
2023-04-14
Fixed
- Fix unable to create optimization when only a single preview point is available.
2023-04-12
Added
- Remember and display recently used histogram KPIs in optimization comparison.
- Add autocompletion when selecting histogram KPI from dropdown in optimization comparison.
Changed
- Stock and Discount are no longer displayed by default in histogram of optimization comparison.
2023-04-05
Added
- Notify user about new comments of other users on optimizations, rules and scopes
2023-03-28
Added
- Add checkbox for search with exact matching in optimization comparison table.
Changed
- Moved Elasticity KPI to Pricing section of the optimization comparison table.
- Elasticity KPI definition change: Use midpoint formula only for the price change from Current Price to Optimal Price.
- Competitive Positioning is now a percentage value: +10% means the Optimal Price is 10% higher than Min Competitor Price.
Removed
- Removed unnecessary internal KPIs from optimization comparison table.
2023-03-22
Changed
- Enabled new Google Sign In
- Profit Margin is now among main KPI choices for histogram above comparison table.
Fixed
- Fixed incorrect profit curves in comparison table for optimizations shorter than 2 weeks
- Fixed maximum revenue target sometimes failing to be preselected when copying optimization
2023-03-15
Fixed
- Fix daylight saving time might cause incorrect date range
2023-03-10
Fixed
- Fix not visible products in the comparison table for some optimizations.
2023-03-09
Added
- Display competitor prices in comparison table under Pricing->Explain.
Changed
- Exclude internal columns from compare table download.
Fixed
- Fix profit margin not shown for optimizations with one target.
2023-03-01
Changed
- Improve clarity of automatically selected targets notification
Fixed
- Immediately show password strength feedback in "Reset Password" form.
2023-02-23
Fixed
- Fix incorrect user information in optimization status
2023-02-15
Fixed
- Fix displaying newly added comments at real-time.
2023-02-10
Changed
- Relevant filter columns will be included in scope download
- Targets will be preselected based on margin instead of revenue when copying optimization
- Move created by and edited by columns to status feed instead of the main table for scopes and rules.
Fixed
- Fix display of missing dates in comparison table.
2023-02-02
Added
- Autocomplete is added when searching for categorical columns in the comparison table.
- Add plot of predicted profits for different product prices in Pricing->Explain column of comparison table.
- In the comparison table under Pricing->Explain, display additional tags to better understand factors considered in pricing decision.
Fixed
- Fix not able to edit search term without specified column.
2023-02-01
Fixed
- Fix unable to add comments for rules.
2023-01-31
Fixed
- Fixed preview not loading for some optimizations
2023-01-28
Fixed
- Served stale cached changelog
2023-01-27
Added
- In the optimization page, clicking on the status icon will display the history of the optimization. It is possible to collaborate by leaving comments. This feature is enabled as well for scope and rule pages by adding a new status icon to the table.
Changed
- Group general filters under 'Identifiers'.
- 'Applied rules' and 'Failing rules' filters are moved from Pricing section to first-level menu above 'Identifiers'.
- Display the name of selected item in the title of History section.
- Automatic log out will occur after 15 minutes if tab is out of focus.
- Preview curve now starts at maximum margin instead of minimum revenue point.
Removed
- Remove 'Passing all rules' from filter menu in the comparison table.
2023-01-12
Changed
- Adjust size of notification dropdown.
- Make filter definitions easier to access during scope creation.
2023-01-04
Fixed
- Unable to perform upload
2023-01-04
Added
- In the optimization comparison table, when clicking on the filter icon, there will be a new item 'Applied rules' under the Pricing section. This new filter will open a dialog with a drop-down containing all the rules names from the selected optimizations. It will show the products where that selected rule was applied. Note that the filter is enabled only for newly created optimizations.
- In the optimization creation page, Main forecast will be on top of the list and followed by the forecasts with voucher spending in ascending order, if available.
2022-12-28
Fixed
- The optimization comparison table keeps stable columns after filtering
2022-12-22
Fixed
- In the optimization page, clicking the view button will only close the optimization comparison table.
2022-12-21
Changed
- Updated to Angular 13
For improved security and a few framework bugfixes.
- In the optimization page, you can hide or show an optimization in the comparison table using the new eye icon. When you click on the icon, it will also change its state (open/close).
Fixed
- When hovering over the rules in the Pricing/Explain column in the optimization comparison table, a shortened bar appears instead of a price range bar for all rules with equal min and max prices.
- The optimization comparison table will always stay open when an ongoing optimization is completed.
2022-12-14
Changed
- Display full forecast name in optimizations table.
Fixed
- All opened dialogs are closed on logout.
- Key section in optimization comparison table always displays all available KPIs.
2022-12-09
Added
- Automatically log out if tab is out of focus for 5 minutes.
2022-12-02
Added
- Date picker is now available when creating a date-based scope filter. It allows to choose an operator and a value from available dates.
- Search terms for exact matching start with '='.
- Renaming the optimization settings is possible.
Changed
- Adding/editing search terms will open a dialog, instead of in-place inputs.
Fixed
- The arrows from compare table are now matching the logic of ordering, up = ascending, down = descending ordering.
2022-11-28
2022-11-24
2022-11-23
Added
- Support exact match when clicking on an item from the compare table
Removed
- Remove delete batch buttons and unneeded checkboxes
2022-11-16
Added
- New Feature: Pinned optimization settings. For convenience, most frequently used optimization settings can now be pinned to the top of the list, and reused to create new optimizations. Click on the pin icon to the left of an optimization to have its settings always available.
- Show loading status for scope filters
- Support date scope filters
2022-11-09
- remove fallback to main currency for unknown market
- Get static asset notifications from http request
- Improve backend performance
- save timestamp of last read notification
- Frontend/use static changelog for notification
- fix #11630 - Use static changelog for release notification in frontend
- fix #10920 - Remove fallback to main currency for unknown markets
2022-11-02
- Backend/fixup 10339
- Notifications for changes
- add padding right to expand context menu
2022-10-26
- Fix unable to refresh backend
- Frontend/fix hardcoded key columns
- Backend/capture missing column error
2022-10-19
- remove header border
- Close feedbackform after timeout
- Client/configurable integration names
- display 2 columns in the dropdowns for the description
- add info helptext in optimization form
2022-10-10
- Backend/fix 11063 custom csv format
- Core/remove partitioned optimization result flag
2022-10-05
- client survey
- editable dashboard search terms pills
2022-09-29
- Re-add
cur_price_changein comparison view. - Only replace
optimizationstable - Core/forecast kpi renaming
2022-09-22
- fix #10661 - incorrect date range when submitting opt
2022-09-21
- Fix unable to save upload error event
- Render histogram only after loading complete
- fix #7902 - rename default opt_download table to opt_price_change
2022-09-19
- always select present optimization range
- fix #10661 - wrong forecast selected for given date range
- fix #10642 - Date range is not updated automatically / new dates are not available for selection
2022-09-14
- Backend/fixup 10420 get kpi failed
2022-09-14
- fix #10596 - Date range update still available even without forecast
- forecast variant selection
- adjust dbt optimizations table
- fix #9693 - Enable csv download for snapshots not associated with any integration
2022-09-05
- add plausible analytics to app
- Remove BCC recipients from reset password email
- Add all forecast columns to optimizer result.
- fix #7677 - order- and copyable scope conditions
2022-08-30
- fix #10259 - current predictions in dashboard not aware of marketing_option
2022-08-23
- fix #10108 - allow negative rule values
2022-08-12
- fix #9927 - Unable to update backend via pipeline
- Backend/remove data type checking
- Frontend/resolve 9786
- Frontend/resolve 9809
- Prefer section from kpis.yml over hard-coded front-end config
- Frontend/fix 9060 allow saving red entries
- fix #9592 - allow analytical function in rules
- fix #9220 - Don't add KPIs if they are all NULL OR all default
- fix #4758 - Prefill rule value
2022-07-28
- Core/add roas kpi
- fix #9534 - Veto selection still exists after log-out and log-in.
- fix #9522 - Enable Percent formatting like 0.12%
2022-07-18
- Always create comparison snapshot
2022-07-14
- Do not apply veto to snapshots that don't support it.
- Frontend/support (almost) any type search
- Update Django and related packages
- fix #9371 - Optimization view in front end keeps loading when sorting by boolean column
- Optimizer/configurable snapshots
- fix #8726 - Restructure download section
- fix #8197 - Veto button
2022-07-08
- fix #9372 - Positive profit change is displayed with minus in fontend optimization list view
- Disable view opt. button on status=progress
- Aggregate extreme cur. prices on opt. group level
2022-07-07
- use tooltip to show absolute result values
- machine-readable, centralized KPI definitions
- Frontend better optimizations list
- rename opt_download table to opt_price_changes
- fix #7845 - More Visual Optimizations Overview Table
2022-06-24
- Enable search on opt_id
- fix #8953 - No price change scenario displays wAvg Price change higher than 0%
- fix #8825 - BQ type specific column formatting
2022-06-17
- Move
partitioned_optimization_resultflag to dbt vars
2022-06-16
- Remove legend box border.
- Determine opt. colors at time of comparison.
- fix #8582 - Add opt legend to comparison
- avoid horizontal scroll
- Standalone optimization table
- fix #8137 - Better product search in compare component
2022-06-07
- Frontend/last login fix
- Rename 'Current Prices` to 'No Change' in preview.
- Rename internal section key from
predictionstofinancials. - fix #8253 - Suggestions for comparison table
- fix #2824 - Show do-nothing scenario in comparison automatically
2022-05-19
- Improve backend startup performance
- Fix optimizer deadlock in the forked process
- Add KPIs from latest forecast
2022-05-13
- fix #8329 - fix optimizer deadlock
2022-05-12
- Improve inventory KPI descriptions
- Update histogram columns only when extremes not empty.
- Log optimizer request for debugging
- Serve static files from GCS
2022-05-11
- Do not load unavailable columns from cache.
2022-05-11
- Check if columns in explicit visible list are available.
2022-05-11
- Prevent concurrent optimiziation
2022-05-07
- Fix race issues while updating optimizer results
- fix #5263 - add optimization group/value to optimization output
- Frontend/updade hist kpis
2022-05-04
- More price columns in the price section
- update kpi definitions
- fix #8218 - Enable cpu allocation on production
- Frontend/improve compare table
- fix #7735 - integrate optimizer into backend
2022-04-26
- Backend/case insensitive password reset
2022-04-21
- Only check upload perm when needed and leftover model renaming
2022-04-21
- Rename Scenario to Optimization
- Fix throwing invalid exception
- drop unused libcoinor and deps
- Backend/upload role
- test background cpu allocation on dev instances
2022-04-04
- fix #7868 - position all buttons as sticky column on table end
- fix #7190 - Limit histograms in front-end
2022-03-29
- fix #7447 - Single click to view optimization
- fix #7279 - Better range display on front-end comparison histogram
- fix #7768 - Reset table scroll on pagination
- fix #7273 - Prefill new optimization with latest from selected group
- fix #6841 - Frontend not displaying login error
- fix #6433 - Frontend shows [object Object] popup on network errors
- fix #5159 - Remove separate turnover target input field
2022-03-24
- fix #6974 - out-of-sync dashboard optimization selection
- Increase default page size to 50 in compare table.
- fix #7468 - overlapping tick labels on compare overview graphs
- fix #7017 - Signature verification error during token refresh #7587
2022-03-22
- fix #7738 - comparison dashboard mixes up graph order
2022-03-19
- paginate optimization comparison table
2022-03-18
- fix #7593 - conflicting rule names in different groups
- confirm deletion of resources
2022-03-17
- fix #7469 - backend matches unrelated tables as forecasts
- fix #7240 - stop frontend status updates on logout
- fixup #7529 - upgrade to newer pipeline endpoint
- fixup #7551 - synchronous backend update from pipeline
2022-03-11
- fix #7490 - invalid jwt tokens logged from audit middleware
- fix refreshing product filters via admin panel
- Update to latest django-ninja v0.17.0
2022-03-07
- fix #5948 - fixed comparison table header
- centralize error reporting
- fix migration without matching forecasts
- log password reset mails being sent
2022-02-23
- fix #7289 - plenty of bad requests for outdated frontend instances
2022-02-23
- fix #7288 - pipeline refresh fails
2022-02-22
- fix #6834 - missing rounding for 0% bucket
- fix #7215 - error at rule creation in user groups
- bump product limit to 500,000
2022-02-18
- fix #6233 - modular filter query
- fix #6709 - scenario comparison not loading
- fix #6725 - Show profit margin on preview tooltip
- fix #6993 - Special characters in the product search bar result in an infinite loop
2022-02-10
- fix #5728 - negative relative profit change with negative current profit in preview
- fix #5831 - add user groups
- fix #5905 - configurable optimization up-/download
- fix #6775 - add "benchmark" in the list of words that are associated with percentage representations
- show predicate and interpolated price in rule admin form
2022-01-21
- fix #6317 - update python and deps
- fix #6577 - forward-compatible project config deployment
2022-01-14
- fix #6361 - same synthesized prices can break interpolation
- fixup #3977 - current prices always included as optimization options
2022-01-06
- fix #6390 - incorrect number of rules shown in explain column
- rename optimal_price to revenue_profit_target
2022-01-04
- fix #6359 - Optimal price displayed as current price range bar
2021-12-20
- fix #6239 - Optimal price displayed as current price
2021-12-19
- implement #3977 - rule prioritisation
- implement #6209 - rule explain section
- fix #6211 - synth rule opt values break fallback group consistency
- fix #6205 - replace opt value hashes with defined strings
2021-12-10
- support unknown pipeline config fields in backend runtime config
2021-12-09
- fix #6046 - event refresh hitting rate limit
2021-12-02
- fix #5939 - frontend removes valid options
2021-11-25
- upgrade filter.sql to support string optimization_value
2021-11-23
- upgrade backend database to PostgreSQL v13
2021-11-18
- fix #5371 - broken table header after drag&drop
- fix #5561 - drop embedded datastudio dashboards
- fix #5309 - spurious ProgressEvent error toasts
- fix #4574 - allow stale scope filter entries
- fix #5582 - preview error on submitting copied scenario with invalid rule
2021-11-11
- fix #5284 - drop support footer
- fix #5293 - use session storage to keep compare forecast KPIs
- fix #5379 - renew DB password in time
- fix #5589 - Enable OAuth2 username in the auditlog
2021-10-18
- fix #5255 - calculate preview points in consistent way with optimizer
- fix #5288 - enable Polish locale
- fix #5191 - disable comparison if no scenario has been selected
- fix #5173 - round to 2 decimal places in preview
- fix #5150 - deactivate compare forecast until optimization is finished
- fix #5115 - optimization failed yet the status still is processing
- fix #5057 - update Angular to v12
2021-10-04
- fix #223 - live status updates of optimizations
2021-09-27
- fix #4898 - preview broken with nested optimization values
2021-09-16
- fix #4865 - optimizer misses few prices due to rounding
2021-09-16
- handle mismatched field type and BQ type
2021-09-14
- fix #4299 - product-level comparison table
- fix #4735 - improve comparison histogram section
- fix #4695 - limit compare column widths
- validate forms on submit
2021-09-03
- fix #4525 - remove optimization size
2021-08-31
- fix #4579 - drop project cfg.yml from backend
2021-08-31
- fix #4569 - drop project cfg.yml usage from backend
2021-08-27
- fix #4547 - invalid S3 bucket name
v1.9.1/v1.9.2 - 2021-08-27
- fix missing AWS S3 library
2021-08-27
- implement #2888 - configurable optimization upload integration
2021-08-16
- fix #4368 - optimizer ran out-of-memory
2021-08-10
- fix #4341 - broken upload/synchronize integration deployed to all projects
2021-08-09
- fix #4323 - optimizations not saved in BQ due to schema mismatch
2021-08-06
- fix #4292 - Render only rule names in filter query
2021-07-27
- fix #4134 - failed to download scenario
2021-07-27
- much faster optimizer (#3493, #3822)
- overhauled backend API implementation (#3526)
2021-07-09
- fix #3885 - failure when posting scope with multiple and conditions
- fix #3856 - renaming scopes leaves cached rules with invalid scope name
- fix #3886 - form-select/autocomplete not filtering by displayed value
- faster optimizer
- faster backend
2021-07-06
- fix #3768 - Display norwegian krone on frontend
2021-06-30
- fix #3726 - sorting by columns in comparison table not working
- fix #3702 - abbreviated select options
- fix #3727 - invalid scopes in comparison summary
2021-06-29
- flexible scope definition (exclude lists, OR combinator)
- fix #3219 - display share KPIs as %
- refactor frontend to be simpler and more aggressively cache backend data
2021-06-11
- fixup #3167 - fix incorrect preview graph boundaries for fixed price rules
2021-06-09
- fix #2418 - list applied rules in optimization comparison table
2021-06-02
- fix #3358 - broken password authentication for optimization download
2021-06-01
- optionally sorted optimization download
2021-06-01
- fix #3347 - dev forecasts published to production instances
- fix incorrect elasticity aggregation in optimization download
2021-05-31
- fixup #3331 - fix admin scope/filter refresh
- list allowed special password characters
2021-05-29
- fixup #3269 - fix scope product count with separate forecast tables
2021-05-28
- fix #3205 - use separate forecast tables
2021-05-27
- include predicted sales in scenario preview and result
- improve scenario preview curve
2021-05-21
- fixup #3203 - configurable column order of legacy optimization integration
2021-05-18
- fix #3199 - historize all forecast predictions in optimization result
2021-05-12
- fix #2842 - separately customizable optimization download
- fix #3162 - add optional ordered row index to download csv
- fix #3160 - configurable csv download line separator
2021-05-07
- fix #3123 - boolean scope attribute selection not working
2021-05-03
- fix #3060 - KPI formatting fails in comparison table
- rename optimizations_download to optimizations_comparison
2021-04-30
- followup #2907 - format rate KPIs as percentages
2021-04-28
- followup #1535 - strip leading zeros of pasted numeric selections by parsing them as numbers
2021-04-28
- fix #2907 - format KPIs in optimization comparison dashboard as percentages or currency
2021-04-23
- fix #2949 - percentage categories in histogram are plotted as linear numbers
- fix #2889 - unable to remove a scope in some cases
- fix #2883 - update forecast information may fail
2021-04-15
- fix #2843 - lagging frontend
2021-04-14
- implement #2424 - comparison histograms for all optimization KPIs
- implement #2361 - add revenue-weighted price change to comparison bar plots
- implement #2537 - live-update rule templates
2021-04-08
- fix #2763 - update rule template
2021-04-06
- fix #2715 - update rule template
2021-03-31
- fix #2686 - too eager predictions rounding in comparison dashboard
2021-03-30
- update rule templates
- fix #2572 - changing optimization artifacts
2021-03-24
- fix small KPI inaccuracies in filter rules
2021-03-24
- update rule templates
2021-03-23
- fix #2580 - preview error with zero revenue/profit
2021-03-19
- few smaller improvements
2021-03-10
- fix #2287 - handle scope deletion while updating product counts
- fix #2393 - allow jagged rows when importing CSV
2021-02-18
- fix #2238 - support additional product_attributes in customized optimization download
2021-02-18
- fix #1968: missing datastudio dashboards
2021-02-17
- redesigned scenario table and support batch actions
- new scenario comparison dashboard and direct optimization download via frontend
- migrated rule KPIs in forecast (and deploy updated rule templates)
- switched from App Engine to Cloud Run on Google Cloud to enable faster deployment
2021-01-27
- hardened backend database security
2021-01-06
- better automatic testing of rule templates for every forecast and code change (frontend might warn about deprecated rules that need to be updated)
- fix #1620 - preview graph outside of x/y-axis for fixed price rules
2020-12-23
- fix #1634 - optimization zip upload produces gzip-compressed files
- fix #1616 - incorrect or stale product count in scopes
2020-12-16
- faster optimization scenario preview for scopes with many options (e.g. hundreds of products)
- reworked optimizer to support a lot more products
Frequently Asked Questions
This is a collection of frequently asked questions from our users.
How can I analyze the results of an optimization?
You can check the details of the optimization by clicking on the "eye" icon.
If this is one of the first optimizations you want to upload, it makes sense to check generally if the data seems valid to you. That can include checking the validity of current prices, product attributes, as well as red price discount and voucher levels.
If you are already familiar with optimizations in general and established data quality, it is often useful to analyze the most extreme price predictions by ordering the optimization results by price change, as well as checking the recommendations for high sellers, using the profit and revenue prediction filters. If you want to understand better what led to the price recommendation, you can check the diagram in the "Explain"-column, which will give some context for the recommendation. Lastly, it can be useful to check if there are products at negative margins, and if a price increase is recommended accordingly.
How long are optimization results available?
Old optimizations, comparison tables and uploads are available for two years in the front-end. Forecasts are only available for 3 month, as they take-up a lot of space. To increase data retention times, we can set-up a back-up flow into a cloud bucket in the upload section to save data for more than 2 years.
How do you create an optimization scenario with single or multiple targets?
Access the "Optimizations" page within your domain and click "Create." Provide a name, select the latest forecast, and define the scope for your target. For multiple targets, click "+" to add more targets and specify their respective scopes. You can include pre-defined rules for each target, such as "current price" or "interpolated price" rules. Finally, click "Submit" to create the optimization.
When is the new forecast going to be ready?
The new forecast is ready as soon as our machine learning pipeline to update the forecast ran through. Our pipeline is scheduled to start every day at the exact same time and includes the following steps:
- We check the quality of your new data -> data quality issues will delay the pipeline
- We train new models based on your new data and test them -> test errors will require a 7L Data Scientist to check
- We create a new prediction with the new models and test it -> test errors will require a 7L Data Scientist to check
How can I compare several optimizations?
The compare dashboard enables side-by-side analysis of different scenarios or data sets. For this, simply click the "eye" on more than one optimization at a time. Apply filters based on specific criteria or variables to refine your comparison and focus on relevant information.
How can I schedule an optimization upload?
To schedule an upload, go to the "Upload" page and click the "Create" button. Set the desired upload time (e.g., after 2 minutes). After a short period, you'll receive an email notification requesting approval for the pending upload. Click the link in the email and confirm the upload. The status on the platform will update to reflect the successful upload, and the data will be available for use in optimizations.
Why are some optimized prices outside the requested price range?
The current price is always considered as a potential price point. For example, even if you requested to limit price points below the recommended retail price (RRP), the optimal price may still exceed the RRP if the current price is higher. In this scenario, to ensure that the optimal price remains strictly below the RRP, apply the following rule:
Optimal Price ≤ RRP × 100%
This rule guarantees that the optimal price will never exceed the RRP even if the current price is higher. You can find more information in section Rules.
How can I download optimization data?
To download optimization data, click the upload/download icon located to the right of the eye icon in the Optimization Overview. This will allow you to download a CSV file of the Comparison Table.
How can I get support when using the Pricing Tool?
On the right-hand side of the Pricing Tool, you will find a Help Desk option. From there, you can create a support ticket for our team.
When submitting a ticket, please choose the category that best fits your issue — Bug, Question, or Feature Request — and provide a clear and detailed description. You can also attach screenshots to help us understand the context.
Our team will respond as quickly as possible, and you will receive a notification once we have replied.
How and when can I re-run the pipeline?
You can re-run the pipeline yourself whenever the tool notifies you of a data issue that needs to be fixed. After resolving the issue, you do not need to wait for a data scientist to re-run it for you. Simply go to the Pipeline Status option on the right-hand side of the tool and trigger the re-run from there.
How is the optimal price chosen?
In the Optimization Comparison Overview, under Pricing+, there is a field called "Why this price?". This field explains how the tool arrived at the optimal price for each market–channel–product combination (or other configured levels of granularity).
When you click the icon in this field, you will see:
- The current price
- The list of allowed prices configured for that product
- The pricing rules applied to the product
- How each rule affected the allowed prices to determine the final optimal price
How pricing rules are applied:
- Rules are applied in priority order, from top to bottom
- Higher-priority rules are applied first
- Optimization starts with all allowed prices for the product
- Each rule filters the remaining allowed prices based on its conditions
- The output of one rule becomes the input for the next rule
What happens if a rule removes all prices:
- If a rule filters out all allowed prices, the rule is marked as failed
- Failed rules can be viewed in the Optimization Dashboard
- A fallback rule is then applied if configured
Final price selection: After all applicable rules are processed, the optimization logic evaluates the remaining prices using predicted profit and the configured steering target to select the optimal price.
Why are the rules not applied as I expected?
There can be several reasons why a rule is not applied:
- Contradicting rules – Two or more rules conflict with each other. You can quickly identify such “failing rules” by filtering for failing rules in the filter menu.
- Price option rejected by a rule for one product in the optimization group – In this case, that price option is immediately removed and cannot be used for any product in the group.
- Allowed price range is not sufficient – The range is narrow to set the desired price or apply the rule.
How can I expand the list of allowed price points available for optimization?
There are two ways to introduce additional price points:
-
Update the allowed price points: if you need to expand the set of allowed price points, please create a support ticket via the Help Desk so our team can update them for you.
-
Use a price-generating rule: rules that use the “=” operator can generate new price points. For example, you can create a rule that sets the price to Purchase Price × X. This will produce a new price point, which will still follow any rounding rules defined for your allowed price points.
Can I use one rule across several different scopes without creating duplicates?
Yes! There are two ways you can achieve the desired flexibility:
-
Adjust the scope of a rule directly in the optimization definition.
When creating an optimization, simply click on a rule and select the scope you want to use. This makes it easy to apply the same rule across different scopes. -
Group rules together using the grouping option on the right-hand side of the Rule when creating an optimization.
This allows you to combine multiple rules—such as the same rule template applied to different scopes—and use them together within an optimization.
How does the tool handle a product that belongs to multiple scopes?
If a product appears in more than one scope, the tool will display a “scope overlap detected” warning when you run an optimization. In this case, the tool optimizes the smaller (more specific) scope first, and the larger scope will not influence the result for that product.
What is the Optimization Group Identifier in the optimization comparison view?
An Optimization Group is a feature that treats a specific set of products as a single unit during price optimization. It can be a combination of market, channel, product group id, or product id It ensures that the prices of related products move together. The system determines the optimal relative price change (e.g., a 10% decrease) for the entire group, preserving the established price relationships (the price gap) between the items.
How does the pricing work inside an Optimization Group?
The optimizer decides on a single, uniform relative price change for the whole group.
| Scenario | Before Optimization | Optimal Change Decision | After Optimization |
|---|---|---|---|
| Product A | $10.00 | All products decrease by 10% | $9.00 |
| Product B | $20.00 | $18.00 |
The price difference (e.g., Product B is always twice the price of Product A) is maintained, but all prices shift up or down together based on the optimal decision for the group.
How do my pricing rules affect products within an Optimization Group?
Rules are tested individually for every product, but they impact the entire group's decision.
If a specific price option (e.g., increasing the price by +10%) is rejected by a rule for just one product in the group, that price option is immediately removed and cannot be used for any product in the group.
The final, optimal price change chosen must be applicable to all products in the group without violating any individual product's rules.
How can I include competitor price data in the pricing tool?
You can provide competitor price data as part of the daily import together with your other data tables. The required format and structure are described in Section 3.9, where you will find the full specification for the competitor price table.
Once the data is provided, you can use the existing rules to incorporate competitor prices into your optimization:
- Optimal Price ≥ Min Comp Price × value
- Optimal Price ≤ Min Comp Price × value
- Optimal Price = Min Comp Price × value
These rules allow you to anchor your optimized prices to competitor pricing as needed.
How does the system determine the initial price or discount for a new product with no sales history?
Initially, you can set a starting price and purchase price for the new product. Because the item lacks historical transaction data, the system determines its pricing behavior through a two-stage process:
-
Cross-Learning: The system identifies "comparable" items already in the system by looking at attributes such as category, season, and brand. It initially assumes that costs and elasticity are similar to these products.
-
Direct Learning: As the product generates incoming transactions, the model learns from it directly. It then adjusts the initial assumptions to reflect the product's actual performance.
The exact attributes influencing this cross-learning vary by model. If you have insights into specific factors that influence your products' elasticity, costs, or sales, please let us know so we can refine the model.
Can I prevent new products from being discounted for a specific period after launch?
Yes. You can define rules such as "Discount = 0%" for specific scopes (e.g., "New Arrivals") to ensure they remain at the Recommended Retail Price (RRP).
If a "new product" flag is not already available in your data, you can add a custom column to your Product Attributes table (e.g. FLAG_NEW). Using this attribute, you can create a specific scope in the app to maintain a price stability for these items by applying a fixed price or discount constraint.
If a specific rule you require for new products is not available in the tool, you can create a ticket requesting the feature and we will add the rule for you.
- AB Group
- Field used for testing optimization impact
- Active Since
- Time at which the values in this row changed as an ISO 8601 UTC timestamp (e.g. 2022-04-24T22:54:51Z)
- Active Till
- Timestamp until which a KPI had a certain value (ISO 8601 UTC 2022-04-24T22:54:51Z)
- Aggregated Sales Difference
- Predicted Sales Before Returns over Actual Sales Before Returns
- Stock
- Stock of the product distributed to one specific market and channel.
- Availability
- Number between 0% - product not available to purchase and 100% - fully available for purchase
- Avg Commission Cost
- Cost paid to a third party platform for selling the item on the platform per sold item after returns
- AVG Comp Gross Red Price
- AVG of all available competitor prices for the product
- Conv Fkt To Main Currency
- Average factor the foreign currency has to be multiplied with to get to values in the main currency (e.g. 1.2 to get from GBP to EUR). This average is derived from the lastest transactions.
- Cost Per Click
- Average cost of getting one paid click. 11 EUR marketing cost / 11 paid clicks = 1 EUR avg_cost_per_click
- Avg Gross Red Price
- The daily average gross red price for which a product was sold (effective price). This value is including tax and is in the original currency
- Avg Inbound Cost
- Return cost in main currency per returned item
- Avg Marketing Cost
- Marketing cost in main currency per sold item before returns
- Avg Other Cost
- All other costs per sold item before returns. This cost has similar behavior as avg_outbound_cost and avg_marketing_cost
- Avg Outbound Cost
- Cost of sending the product from the warehouse to the customer minus any shipping revenue paid by the customer in main currency. Outbound cost can include logistic cost, shipment cost, call center cost and payment cost
- Avg Purchase Price
- Historical net cost of 1 good sold (without tax) including shipping cost to the warehouse (e.g. landed cost) in main currency
- Avg Raw Margin 365 Days
- Average raw margin over 365 days
- Raw Profit Margin
- Profit Margin after Purchase Cost and before all other costs including vouchers for the products in the optimization
- Avg Red Price Discount Spending
- The EUR value you spend per (sales_before_returns - returns) for volume discount for example, 10% less if you buy 20 items or more, 3% sconto for paying cash, aftersale discount on red price to avoid a return, customer specific discount for a large customer (e.g. Siemens).
- Avg Voucher Spending
- The EUR value you spend per (sales_before_returns - returns) for vouchers like newsletter vouchers.
- Basket Position
- Rank that SKU has in the basket
- Benchmark Group
- Group of products used to estimate the seasonality of the product and its long-term sales potential. This group is also used to calculate the Benchmark Sell Through Rate.
- Benchmark Sell Through Rate
- Share of product's Sales Before Returns expected to be sold within the short-term forecast period (default 14 days) divided by Sales Before Returns until the Liquidation End Date
- Brand
- Name of the brand of the product
- Bundle ID
- Unique identifier of a bundle of products. Is mapped as product_id in all other tables (i.e. transactions, prices).
- Channel
- Sales domain where the product was sold (e.g. amazon.de for Amazon sales channel)
- Channel Currency
- Three letter code for local channel specific currency according to ISO 4217 (e.g. EUR for Euro currency)
- Color
- Main color of the product
- Commission Cost
- Net commission costs in main currency paid for selling these products on a third party platform (e.g. Zalando, or Amazon)
- Commission Rate
- Share of the gross red price spend on commission cost for selling these products on a third party platform (e.g. Zalando, or Amazon)
- Commission Rate Start Gross Red Price
- Gross Red Price in local currency from which the corresponding commission rate should be applied. The corresponding commission rate will be applied up to the next highest Start Gross Red Price. If no higher Start Gross Red Price is specified, the corresponding commission rate will be applied to all prices higher than that price.
- Comp Delivery Time
- Number of days the competitor needs for shipping the product to the end customer
- Comp Red Price
- Gross Red Price after discount including taxes in local currency excluding Shipping Price
- Comp Is Active
- True if the product is online in the webshop and could be bought by the end customer in that period
- Comp Name
- Name of the company selling the crawled product
- Comp Shipping Price
- Price for shipping the product from the competitor warehouse to the end customer in local currency
- Competitor URL
- Link where the Competitor Price was crawled from
- Conv Fkt To Main Currency
- Factor the foreign currency has to be multiplied with to get to values in the main currency (e.g. 1.2 to get from GBP to EUR)
- Competitor Count
- Count how many competitors are in the competitor statistics like the Min Comp Price
- Cross Sell Category
- Split of products by the amount of avg. cross sell in 5 equally large buckets. Cross sell is calculated as the total revenue from other products bought in the same basket over the last 90 days, after the return period, but only when the product was the basket opener, defined as being in the first basket position in at least three orders.
- Cur Bundle Discount
- Discount the bundle Gross Red Price has vs. the sum of the Gross Red Prices of the contained products in the bundle
- Current Black Price
- Current Gross Black Price before discounts including taxes in local currency
- RRP
- Current Recommended Retail Price (RRP) provided by the supplier of the product in local currency including sales taxes
- Current Price
- The current gross red price for which a product is sold. This value is including tax and is in the original currency
- Current Price Active Since
- Date that the Current Price became active
- Current Price Online Days
- Days that Current Price was online
- Current Marketing Option
- The latest marketing steering provided
- Cur. Marketing Intensity
- Current intensity of the marketing steering. The higher the number, the more aggressive the steering and the higher the marketing spend.
- Cur Purchase Price
- Current net cost of 1 good sold (without tax) including shipping cost to the warehouse (e.g. landed cost) in main currency
- Customer Lifetime Value
- Incremental future profit increase driven by the transaction in main currency. Is typically higher for new customers and customers with higher repurchase rates.
- Date
- Calendar day in format "YYYY-MM-DD"
- Days since 1st active price
- Counts the days since getting the first active price for the product in the market/channel. We use the earliest active price period for the product or the first sale of the product if that happened earlier.
- Days since 1st Sale
- Counts the days since getting the first sale for the product across all markets & channels.
- Days since 1st Sale Category
- Categorizes products in age buckets based on the days since getting the first sale for the products.
- Discount
- (Gross Black Price - Optimal Price) / Gross Black Price
- EAN
- 13 digit International Article Number (also known as European Article Number)
- Liquidation End Date
- Date by which the product should reach the Target Sell-Through Rate (e.g. season end date) in ISO 8601 format (i.e. YYYY-MM-DD; e.g. 2025-06-30)
- Liquidation End Value
- Product's net value in main currency at liquidation end date to calculate the write-off for the seasonal profit calculation. The purchase price is the default value if not specified.
- Forecast Date
- The forecast's creation date, which is usually also the first forecasted day
- Gross Black Price
- Gross price before vouchers in local currency including sales taxes
- Gross Omnibus Price
- This is the lowest price within the last 30 days or NULL if such a price doesn't need to be displayed according to the "Omnibus Directive" (DIRECTIVE (EU) 2019/2161).
- RRP
- Recommended Retail Price (RRP) provided by the supplier of the product in local currency including sales taxes
- Gross Red Price
- Gross price after discounts and before vouchers in local currency including sales taxes
- Price raw margin 365 days
- Gross red price raw margin in the past 365 days
- Inbound Cost
- Logistic and discard costs in main currency linked to handling these returns.
- Is Active
- Indicator that determines if the product is available for purchase in the specified period, regardless of stock levels or other factors you are already sending.
- Is Own Brand
- True if retailer owns the brand
- Stock-capped
- Boolean flagging indicating if the product sales are limited by the Stock + Stock From Expected Returns. Using stock capping can lead to automated price increases as the optimizer will avoid to run out of stock. e.g. If there is 10 items on stock, we can't predict to sell more than 10 items over the prediction period.
- KVI Rank
- Ranking of how important a product is for the end customer. Rank 1 identifying the most important product. By default, the ranking is based on historical revenue, the number of competitor prices and the historic margin as KVIs are highly price-sensitive.
- Conv Fkt To Main Currency
- Latest factor the foreign currency has to be multiplied with to get to values in the main currency (e.g. 1.2 to get from GBP to EUR), on a channel basis.
- Live Share
- The percentage of products in the optimization for which the optimal price is online.
- Main Currency
- Three letter code for main currency according to ISO 4217 that we use for revenue summation across channels with different currencies (e.g. EUR for Euro currency)
- Market
- Country where the product was sold using ISO 3166 format (e.g. DE for Germany)
- Marketing Cost
- Net marketing costs (SEA, price comparison commission, other advertising) linked to these sales after returns
- Marketing Option
- Marketing steering that led to the clicks/traffic during a period of time
- Campaign Type
- Description of the campaign type used to steer the marketing intensity. We support "CpC" in which case marketing_option_float is the Cost per Click steering, "tROAS" in which case marketing_option_float = 100 / tROAS (e.g. 0.25 for a 400% tROAS), "ACoS" in which case marketing_option_float is Advertising Cost of Sale = Marketing Cost / Revenue (e.g. 0.25 for a 25% ACoS)
- Marketing Intensity
- The intensity of the marketing steering (e.g. 0.7 for 70 cent max cost per click campaigns OR 0.25 for 25% ACoS OR 0.25 for 400% tROAS)
- Max Comp Gross Red Price
- The maximum competitor price crawled for this product
- Max Comp Names
- Name of companies offering the most expensive price for the product
- Med Comp Gross Red Price
- Median of all available competitor prices for the product
- Min Comp Gross Red Price
- Minimum competitor price for the given market and product during that period
- Min Comp Names
- Name of companies offering the cheapest price for the product
- Min Competitor Price
- Smallest Gross Competitor Price in local currency
- Name
- Name of the product
- N-th Most Recent Price Change
- The n-th most recent competitor price period for the given market and product (newest period is 1st)
- Optimal Price
- Optimal Gross Price in local currency for the given rules and targets
- Competitive Positioning
- Optimal Price / Min Competitor Price -1
- Optimization ID
- Unique identifier of the optimization
- Optimal Marketing Option
- The recommended marketing steering
- Opt. Marketing Intensity
- Optimal intensity of the marketing steering. The higher the number, the more aggressive the steering and the higher the marketing spend.
- Opt Name
- Name of the optimization given by the user
- Optimization Group
- Combination of Product ID, Market and Channel which should receive the same optimization result.
- Optimization Value
- Description of the option that was available for the optimizer to chose from. e.g. price 29.99 EUR
- Order ID
- Unique identifier for the order to which the product belongs
- Order Quantity
- The amount of products we recommend to order over the selected period of time
- Order Value
- The value of the order quantity in terms of purchase_price.
- Other Cost
- Other costs in main currency you consider in your profit calculation for these sales
- Outbound Cost
- Costs in main currency of sending these products from the warehouse to the customer. You can add logistic cost, shipment cost, call center cost, and payment cost. And you can subtract shipping revenue paid by the customer.
- Paid Clicks
- Number of visits from paid sources
- Picture
- URL to a Thumbnail of a product picture. Common thumbnail sizes include 75x75, 100x100, 150x150, and up to 300x300 pixels. Typical sizes ranging from 10 KB to 50 KB.
- ACoS
- Advertising Cost of Sales, (ACoS), is a marketing metric that measures the efficacy of a digital advertising campaign. It's calculated as Marketing Cost / Revenue Before Returns
- Commission Cost / Sale
- Predicted cost paid to a third party platform for selling the item on the platform per sold item after returns
- Conversion Rate
- Predicted Sales Before Returns / Predicted Clicks
- Cost per Click
- Predicted Marketing Cost/ Predicted Paid Clicks in main currency
- Customer Lifetime Value
- Incremental future profit increase by sales before returns in main currency. Is typically higher for new customers and customers with higher repurchase rates.
- Elasticity
- Predicted change of demand over change of price from current to optimal using the midpoint formula ((q2-q1)/((q2+q1)/2))/((p2-p1)/((p2+p1)/2))
- Gross Red Price Prior Season
- Average gross red price in the preceding period.
- Inbound Cost / Return
- Predicted cost if customer returns one product in main currency
- Liquidation End Profit
- Sum of profit from sales until Liquidation End and write-offs from stock left-over at the Liquidation End date
- Liquidation End Profit Impact
- Difference between the predicted Liquidation End Profit after optimization vs. the predicted Liquidation End Profit before optimization.
- Liquidation End Profit Optimization Group
- Sum of net profit from sales until Liquidation End and write-offs from stock left-over at the Liquidation End date for all products in the Optimization Group
- Liquidation End Stock
- Predicted amount of left-over stock at the Liquidation End Date in the specific market-channel
- Marketing Cost / Sale
- Predicted Marketing Cost / Predicted Sales Before Returns in main currency
- Net ACoS
- Net Advertising Cost of Sales, (Net ACoS), is a marketing metric that measures the efficacy of a digital advertising campaign. It's calculated as Marketing Cost / Revenue After Returns
- OOS Factor
- Sales Weighted OOS Factor. It is used to correct the sales from last season in the order optimization.
- Other Cost / Sale
- Predicted other costs per sold item before returns in main currency. This cost has similar behavior as avg_outbound_cost and avg_marketing_cost
- Outbound Cost / Sale
- Cost of sending the product from the warehouse to the customer minus any shipping revenue paid by the customer by product in main currency. Outbound cost can include logistic cost, shipment cost, call center cost and payment cost
- Price Change Impact Factor
- Price Change Impact Factor is the predicted sales impact by optimizing prices. It is used to correct the sales from last season in the order optimization.
- Profit Margin
- Predicted Profit Margin after all predicted costs and vouchers for the products in the optimization
- Promotion Rank
- Ranking of Products/Optimization Groups by suitability for a promotion campaign. By default, it is based on Stock Reach and historic Profit/Sale. However, the exact calculation method can be adjusted. As an example, "Promotion Rank <= 100" will select the 100 Products/Optimization Groups most recommended for a promotion in a given sales channel.
- Red Price Discount Rate
- Predicted share of revenue after returns spend on red price discounts in percent (e.g. 3% for paying the order in advance)
- Red Price Discount Spending / Sale
- Predicted amount of revenue after returns spend on red price discounts
- Return Rate
- Predicted Returns / Predicted Sales Before Returns in %
- Revenue per Click
- Predicted Revenue per Click in main currency
- ROAS
- Return On Advertising Spend, (ROAS), is a marketing metric that measures the efficacy of a digital advertising campaign. It's calculated as Revenue before Returns / Marketing Cost
- Sales until Liquidation End
- Predicted amount of Sales after Returns to be sold until the liquidation end date from the start of the forecast period
- Salvage Value Percent
- Percentage of Purchase Price that is left of the net product price after subtracting all inbound and outbound related costs. (Net Price - (Inbound Cost + Outbound Cost)) / Purchase price
- Stock From Expected Returns
- Stock expected to be available from returns of sales in the last 60 days
- STR Liquidation End
- Predicted Sell Through Rate (STR) the product will reach at the Liquidation End.
- Voucher Rate
- Predicted share of net revenue after returns spend on vouchers/coupons in percent
- Voucher Spending / Sale
- Predicted amount of revenue after returns spend on vouchers/coupons
- Clicks
- Predicted Clicks on the product
- Commission Cost
- Predicted sum of net commission cost paid for selling these articles on a third party platform (e.g. Zalando, or Amazon) in main currency
- Customer Lifetime Value
- Predicted incremental future profit increase driven by the transaction in main currency. Is typically higher for new customers and customers with higher repurchase rates.
- Inbound Cost
- Predicted cost for returns in main currency
- Marketing Cost
- Predicted Marketing Cost in main currency
- Stock At Optimization Start
- Remaining Stock at the beginning of the optimization period selected in the Steering.
- Sales until Opt Start
- The amount of Sales After Returns we predict from the first day of the forecast until the start of the selected optimization period
- Stock Reach Weeks Ordering
- Prediction after how many weeks the product is running out of stock based on the optimal gross_red_price.
- Organic Clicks
- Predicted number of visits from sources without direct marketing cost (e.g. direct mail, traffic without marketing cost)
- Other Cost
- Predicted Other Cost in main currency
- Outbound Cost
- Cost of sending the product to the customer minus any shipping revenue paid by the customer in main currency. Outbound cost can include logistic cost, shipment cost, call center cost and payment cost
- Paid Clicks
- Predicted number of visits from paid sources
- Profit
- Predicted Net Profit in main currency
- Profit Margin
- Predicted profit margin.
- Profit Optimization Group
- Sum of net profit after all predicted cost in main currency for all products in the optimization group over the optimized date period
- Profit
- Predicted Net Profit in main currency
- Purchase Cost
- Predicted Sales Before Returns * Purchase Price provided for prediction in main currency
- Red Price Discount Cost
- Predicted Sum of additional discount spending in main currency on top of vouchers and discounts (e.g. 4 EUR customer specific rebate)
- Returns
- Predicted Items to be returned by the customer
- Revenue
- Predicted Net Revenue in main currency
- Revenue
- Predicted Net Revenue in main currency
- Sales After Returns Prior Season
- Sales after returns in the preceding period.
- Sales Before Returns
- Predicted Sales Before Returns for the products in the optimization during the optimization period
- Sales Before Returns
- Predicted Sales Before Returns for the products in the optimization during the optimization period
- Voucher Cost
- Predicted Cost for vouchers/coupons in main currency
- Prev Gross Red Price Ordering
- Weighted 365 day average of the product's gross red price used as baseline for the predictions.
- Price Change
- Difference between the optimal and current prices in %.
- Price Change Direction
- Direction of price change for optimal price compared to current price. Price Increase if optimal price is higher than current price, Price Reduction if optimal price is lower than current price. No Change if optimal price is equal current price.
- Price Change Ordering
- Difference between the optimal price and the Prev Gross Red Price Ordering in %. This gives an indication how the long-term historic price should change for the next ordering period.
- Producer
- Manufacturer of the product
- Product Category 1
- Top-level category the product belongs to (ideally less than 20 distinct category values)
- Product Category 2
- Product sub-category the products belongs to
- Product Category 3
- Product sub-sub-category the products belongs to
- Product Group ID
- Marks products belonging together (e.g. across sizes) - can be used for prices to move in the same direction
- Product ID
- Unique identifier of the product or SKU
- Product URL
- URL where the product can be found
- Profit
- Net profit in main currency after all delivered costs
- Profit Accuracy
- Sum of predicted profit in the optimization divided by the sum of the actual profit over the same period of time. Values close to 100% indicate good predictability.
- Profit
- Sum of net profit after all predicted cost in main currency for all products in the optimization over the optimized period
- Profit Impact
- Difference between the actual (realized) profit and what the profit would have been without the optimization.
- Profit Margin
- Predicted Profit Margin after all predicted cost in % for the products in the optimization over the optimization period
- Promotion Name
- Name of the promotional activity
- Promotion Names
- Array of names of the promotional campaigns, as there could be multiple campaigns running at the same time.
- Purchase Cost
- The sum of net landed cost of all products sold in the transaction, including freight cost from the production facility to the warehouse, customs duties, tariffs, insurance, handling fees, and any other import-related expenses in main currency (i.e., COGS or cost of goods sold).
- Purchase Price
- Net landed cost of a single unit sold, including freight cost from the production facility to the warehouse, customs duties, tariffs, insurance, handling fees, and any other import-related expenses in main currency (i.e., COGS or cost of goods sold).
- Purchase Price Category
- Split of products by purchase price in 5 equally large buckets
- Red Price Discount Spending
- The total net value of extra discounts (e.g., customer-specific rebates) in the main currency, other than voucher spending.
- Returns
- Number of items returned
- Revenue
- Net revenue in main currency after returns, vouchers, and discounts
- Revenue 12 Month
- Sum of net product revenue of market & channels in the forecast in main currency after returns from 2-14 month ago (to wait for returns)
- Revenue
- Sum of net product revenue in main currency after returns (if available) without customer payments for the delivery/return of the product
- Revenue Before Returns
- Net revenue before returns in main currency after vouchers, and discounts
- Revenue Impact
- Difference between the actual (realized) revenue and what the revenue would have been without the optimization.
- Sales Before Returns
- Predicted Sales Before Returns for the products in the optimization during the optimization period
- Sales Before Returns
- Number of non-cancelled items ordered (e.g. 2 if two items were ordered)
- Sales Accuracy
- Sum of predicted sales before returns in the optimization divided by the sum of the actual sales before returns over the same period of time. Values close to 100% indicate good predictability.
- Sales Before Returns Change
- Change of sold items predicted for marketing/price change in % (Capped between -500% and 500%)
- Scope
- Scope(s) which the product is part of
- Season
- Main sales period of the product (e.g. summer, winter, ...)
- Sell Through Rate
- (Sales after Returns since Liquidation Start Date - Stock From Expected Returns)/ (Sales after Returns since Liquidation Start Date + Stock) - for the Optimization Group of the product.
- Sell Through Rate Target
- Share of Stock that should be sold out at Liquidation End Date
- Shelf Location
- Row in an offline shelf where product is usually placed
- Size
- Size of the product
- Liquidation Start Date
- Date from which the Sell Through Rate of the product is calculated (e.g. season start date) in ISO 8601 format (i.e YYYY-MM-DD; e.g. 2025-03-01)
- Stock Change
- Changes to your inventory in the future (e.g. restocking, write-offs, and other inventory adjustments)
- Stock Reach Weeks
- Prediction after how many weeks the product is running out of stock
- Stock Start Of Day
- Number of items available for sale in the beginning of the day
- Tax Rate
- Rate of sales tax used to calculate net revenue from gross price. This value must be provided as a decimal (e.g. 0.19 for 19% for most products in Germany)
- Time
- Date and time when the items were ordered as an ISO 8601 UTC timestamp (e.g. 2024-02-06 22:54:51+00:00)
- Total Clicks
- Total number of visitors to the product's dedicated detail page from paid and unpaid sources (decimal in case several products share traffic)
- tROAS
- tROAS (Target Return on Ad Spend) is a bid strategy used in digital advertising where you can set a desired return on ad spend as a percentage. tROAS = Revenue Before Returns/Marketing Cost
- Upload Channel
- The sales domain where prices will be uploaded (e.g., amazon.de for Amazon sales channel). This is used to distinguish the primary channel in the optimization process from any additional sub-channel where prices are uploaded (e.g., zafr for Zalando France if optimized prices should be sent via an API call to tradebyte).
- Upload Conv Fkt To Main Currency
- The factor by which the foreign currency has to be multiplied to convert to values in the main currency (e.g., 1.2 to convert from GBP to EUR). This is used to differentiate conversion factors from any additional sub-channel definitions.
- Upload Currency
- The currency code according to ISO 4217 format (e.g., EUR for Euro). This is used to differentiate the channel currency from any additional sub-channel definitions.
- Upload End Date
- The day on which the optimization effectively ended, either because the optimization end date was reached, or because subsequent optimizations took over.
- Upload Market
- The country code according to ISO 3166 format (e.g., DE for Germany). This is used to differentiate the market ISO code from any additional sub-channel definitions.
- Upload Start Date
- The day on which the optimization was uploaded.
- Voucher Rate
- Share of net revenue after returns spend on vouchers/coupons in percent
- Voucher Spending
- Sum of net voucher spending after returns in main currency (e.g. 5/(1+0.19)=4.2 EUR voucher for newsletter).
Changelog
Scopes are groups of products in specific markets and channels that can be defined using product attributes, markets, channels and even predicted KPIs. A scope allows you to manage and optimize these groups individually, enabling more targeted pricing strategies for enhanced performance.
Scopes can be created using filters you provide, such as product attributes, stock level, or other relevant criteria. By combining these filters with logical operators (e.g., "AND", "OR"), you can define specific groups for optimized pricing actions.
Create Scopes
To create a scope, navigate to the scope section, click on "Create", name your scope, set the filters, and then submit.

Once a scope is created, you can edit, copy, delete, or download it as needed.
Key Scopes Usage
- Custom Rules per Scope: Easily define and execute rules that apply only to a particular scope, such as excluding products from price changes or focusing on inventory liquidation.
- Segment-Specific Optimization: Tailor your pricing strategy to the needs of individual scopes to meet different business objectives.
Examples of Common Scopes
-
Sales Channel Scopes: Differentiate products based on sales channels (e.g., Zalando, Amazon). This enables creating pricing strategies that consider the unique dynamics of each channel.
-
Seasonal Scopes: You can create a scope based on the seasonal demand (e.g., holiday products, summer collections). This helps in adjusting pricing strategies according to seasonal trends and consumer behavior.
-
Blacklisted Items: This scope includes products where no price changes should occur. Blacklisting items ensures that they are excluded from any automatic pricing adjustments.
-
Inventory Level Scopes: Group products based on inventory levels (e.g., overstocked, low stock). This can inform discounting strategies to manage inventory effectively.
Conclusion
Defining and managing scopes helps your business handle complex portfolios more effectively, enabling flexible pricing strategies that support your goals.
Elasticity
A product's price elasticity of demand is a measure for how much the demand for it reacts to a change in its price. There are multiple definitions for measuring elasticity.
Example:
Our Elasticity KPI is using the second elasticity definition, which is often referred to as "Mid Point Elasticity". The advantage of this definition is that going back from to will give you the same elasticity, so it is symmetric. Also, the Simple Elasticity often comes up with very large elasticity outliers which are difficult to interpret.
We learn Elasticity on market, channel and product level based on product specific price change history and based on product attributes. If we don't have any information on the product specific price history, we approximate it using similar products. To ensure that we capture the true relationship between price changes and sales, we automatically detect seasonal patterns - like summer or holiday trends - and correct the data accordingly. For example, the sales of a seasonal product like sandals, which sells well in summer but less in winter, are smoothed out to account for their summer peak before calculating elasticity.
Forecast variants
Forecast variants enable to simulate and analyze the effects of different forecast configurations. The default forecast, called Main, is generated daily through the daily pipeline run, after receiving the updated data.
Additional forecast variations include voucher rate variants and dev forecasts.
Voucher rate variants
These variants help to evaluate and compare the effect of various voucher rates and determine the optimal prices of the products alongside the selected voucher rate. For example, if a voucher campaign is planned for a specific group of products, forecast variants allow you to simulate different scenarios, such as 10% or 15% voucher rates, to understand which rates are more likely to meet your business targets. This helps to identify the most profitable pricing strategy to achieve higher revenue or profit.
How to use voucher variants:
-
Define a scope for the products included in the voucher campaign.
-
Create an optimization, selecting a forecast variant with your chosen voucher rate (e.g: 5%).

-
Optionally, create additional optimizations with other voucher rates (e.g., 10%) to compare results.
-
Compare the predicted KPIs on the comparison dashboard.
-
Upload the prices that align with your business goals.
How to set up:
If forecast variants are not yet available in your frontend and you would like to try out this feature, please contact a data scientist. In your request, specify the desired voucher rate options (e.g., 5%, 10%, 15%, 20%).
Dev forecasts
These forecasts are versions in development that contain new changes or updates not yet part of the Main forecast. These variants can be made available on the frontend for testing, allowing you to compare optimization results between the Main forecast and the updated versions.
New Optimization
This section describes how to create a new optimization in our app.
Option 1: Copy from old optimization You can create optimizations from an existing optimization by clicking the "Copy Optimization" button. This will copy:
- The scopes of the old optimization
- The rules of the old optimization
- The targets of the old optimization

Option 2: Create new optimization You can create a new optimization by clicking on the "+ Create" button in the optimization section. This will open a new form for creating an optimization.

Optimization Configuration The optimization for lets you configure the following parameters:
- Name: A recognizable description for your optimization. You can change the name later on by clicking on the name in the optimization list
- Date Range: Select which days you would like to make an optimization for. Set automatically to the current date until the last available date of the forecast
- Forecast Variant: Your 7L Data Scientist can create additional forecast variants for special purposes like 20% voucher campaigns on all products
- Last Data Update: Indication when we last updated your forecast
- Rules: New rules can be set-up in the Rules section of the front-end and added to an optimization here. Rules can be prioritized with drag and drop. Rule #1 has the highest priority
- Scopes: Combination of market, channel and product_id that you want to use for your target setting
- Target: Please decide which target type we should persist when we use the optimization settings next time

Optimization Comparison
This section describes how to compare two optimizations in our app.
Open Compare Dashboard
To open the Compare Dashboard please click the "View Optimization" eye in the Optimizations section. To compare a second optimizations with the first one, just click the eye of the second optimization as well.

Histogram
To histogram section enables to visualize the distribution of your optimizations for all columns of the compare table. You can see all available columns by clicking on "Other" below the histogram on the right side.

Filter
You can filter the product specific table by clicking on the filter symbol or by entering a text into the search field.

Column Customization
You can configure which KPIs you would like to see in your dashboard by clicking on the "+" next to each section.

Targets
The target selection enables you to decide which target you would like to persist in the long-run for your product scopes. The selected target will be used every time we rerun the optimization settings.
| Angle | Range | Excellence | |
|---|---|---|---|
| Profit Margin | Changing | Min Margin-Max Margin | ★ |
| Profit Maximum | Constant | Max Profit | ★★ |
| Profit Weight | Constant | 0% - 100% | ★★ |
| Δ Profit / Δ Revenue | Changing | -∞ to +∞ | ★★★ |
-
Profit Margin enables you to steer towards a specific profit margin for your scope. The steering angle where this target is reached will slightly changed based on our predictions. The highest allowed profit margin is the margin at the Max Predicted Margin point, to ensure target uniqueness. The lowest allowed profit margin is the profit margin at the Max Predicted Revenue point. Both points will be influenced by the rules you are using.
Example: "Profit Margin 10%" will always select the point in the curve where your margin is closest to 10%
-
Profit Maximum enables you to steer towards the point that maximizes short-term profit for each individual product within the scope. When rerunning the optimization, the Max Predicted Profit target will be selected.
Example: "Profit Maximum" will increase the price of a product to 19.99 as we predict that the profit of the product will be maximized at this price.
-
Profit Weight enables you to select a specific point between the point that maximizes revenue and profit. When rerunning the optimization, the target closest to the Profit Weight target will be selected.
Example: "Profit Weight 50%" will select the point of the curve just in the middle of the profit maximization point and revenue maximization point.
-
Δ Profit / Δ Revenue enables you to specify, how much profit you are willing to gain/lose for gaining 1 additional revenue. When rerunning the optimization, the maximum profit solution with the Profit-Revenue-Slope closest to your target will be selected.
Example: "Δ Profit / Δ Revenue -0.2" will select the point of the curve where you invest 0.2 profit to gain 1 revenue
Optimization KPIs
Next to the Target KPIs, you can add additional KPIs to the preview curve to be informed about the impact of your target setting on the optimization result. This should enable you to select better targets for your optimization. To configure which Optimization KPI you would like to see, please use the settings button below the curve.

The following KPIs are available
Rules
Using Rules, you can set specific constraints on the options you want to allow. These constraints help filter out any unsuitable options, ensuring that only those that meet your criteria are considered. You can apply optimization rules at a scope level. For example, if you want to ensure that all discounts are below 50%, you can create the rule "Discounts <= 0.5."
Create Optimization Rules
To create a new optimization rule or modify an existing one, navigate to the Rules tab. Click on "Create," and you will be able to choose from a list of predefined rule templates. Once you've selected the rule, define its value, specify the scope it should apply to, and click "Create."
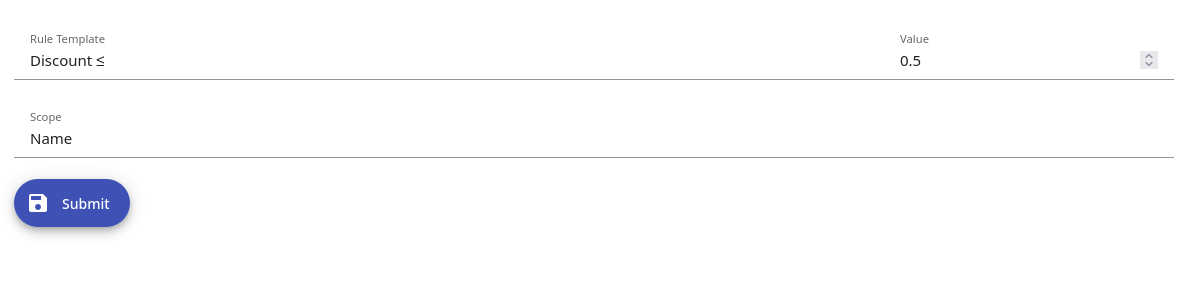
After creation, you'll be redirected back to the Rules tab, where you can optionally add a comment. From this tab, you can always view, modify, or delete your existing rules.
Use Optimization Rules
When you create a new optimization, you can select from the previously created rules to apply them.

Once the optimization is complete, you can analyze the effect of each rule on the price options for various market, channel, and product combinations. To do this, go to the optimization, and under the "Pricing+ -> Explain" column, click on the product you are interested in. This will display how each rule impacts the price options.
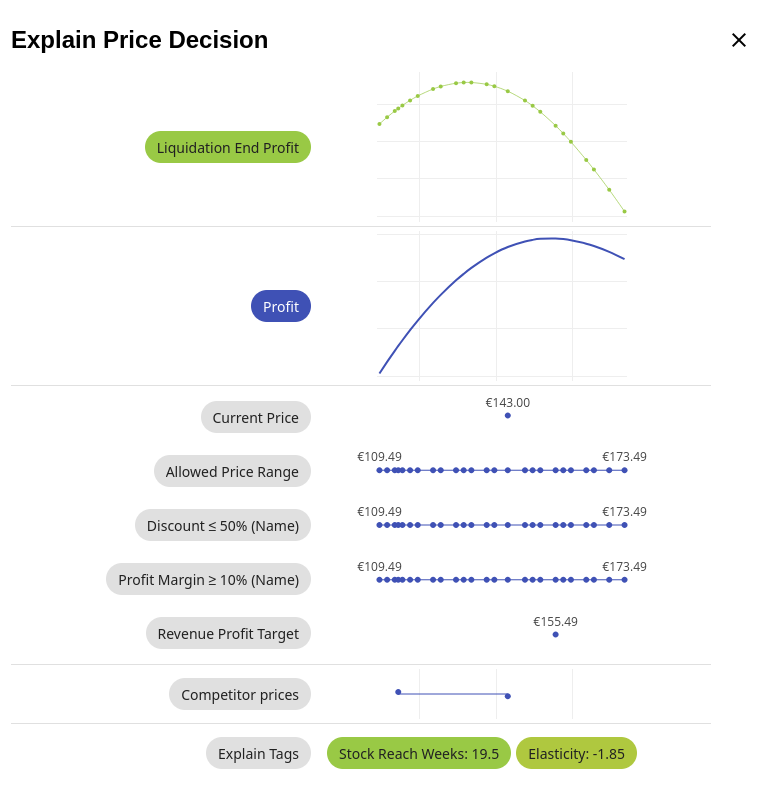
Additional Details
If no price option satisfies a specific rule that was selected during optimization, the closest price option to the rule's threshold will be selected as a fallback. It is important to note that the order of the rules determines their priority. The first rule is applied first, followed by the second, and so on.
Conclusion
Optimization rules allow you to set constraints on price options, ensuring that only those meeting your criteria are considered. As a result, all unsuitable price options are automatically filtered out.
Stock
Our stock handling ensures that your available product inventory is efficiently among all your markets and channels. This maximizes your sales opportunities and helps prevent out-of-stock situations.
How Does Stock Handling Work?
When you have a single pool of product stock (e.g., all units in one warehouse) that needs to be shared across multiple locations, we automatically distribute it based on sales predictions and actual item quantities.
Example
Let's say you have 100 total items of Product A available globally.
| Location | Sales Prediction | Distributed Stock |
|---|---|---|
| Germany | 60 sales | 60 items in stock |
| Italy | 40 sales | 40 items in stock |
Forecast setting: Stock Capping
If you frequently run out of stock or have trouble with overstock, it might make sense to consider stock in your optimizations. We offer multiple options for considering stock.
By default we assume unlimited stock in our predictions. Even if you have only 10 items on stock, we would predict 20 sold items for the next 14 days, assuming that you are able to restock the item during the 14 days.
Your Data Scientist can turn-on stock capping in the forecast which then limits the sales to the items on stock (10) plus the expected stock from returns. This would then automatically increase the price on items with low stock also without the use of a rule.
Rule: Stock Reach in Weeks ≤ Value
This rule can be used to reduce the price on a product. Attention: This rule should always be combined with a rule that sets a min margin like "Profit Margin ≥ Value"
Definitions
- Stock Reach in Weeks: 7Learnings price on how many weeks the current stock will last at the selected price
Example
Value = 4
Resulting rule: Stock Reach in Weeks ≤ 4

Rule: Stock Reach in Weeks ≥ Value
This rule can be used to increase the price on a product automatically in order to make sure the stock lasts a certain amount of weeks.
Definitions
- Stock Reach in Weeks: 7Learnings price on how many weeks the current stock will last at the selected price
Example
Value = 4
Resulting rule: Stock Reach in Weeks ≥ 4

Liquidation End STR ≥ Value
The rule will ensure a target Sell Through Rate (STR) at the liquidation end date. It will push the prices of the products to have a specified STR at the end of liquidation.
Attention: This rule should always be combined with a rule that sets a min margin like "Profit Margin ≥ Value"
Definitions
- STR: Measures the liquidation percentage of sold inventory compared to the total stock available over a specific period of time. A high sell-through rate usually means strong demand or effective pricing while a low sell-through rate might indicate overstocking, poor demand, or pricing issues.
Example
Value = 80%
Resulting rule: Liquidation End STR ≥ 80%
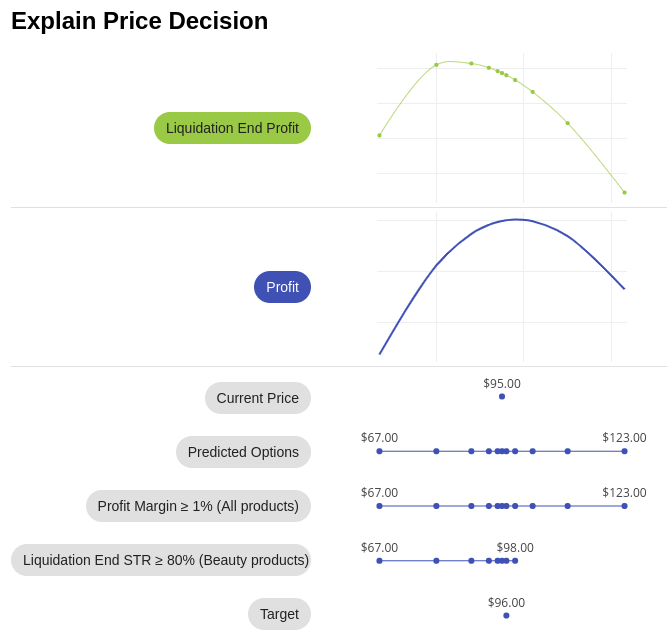
Liquidation End Profit
If you provide us with a Liquidation End Date, we can predict profit at this liquidation end date including write-offs on any stock left at this time.
Sales until Liquidation End
To predict the Sales until Liquidation end we take the predicted sales from the optimization and divide it by the Benchmark Sell-Through Rate. This rate compares sales performance from the same period last year (covering both the short-term forecast and the period leading up to the liquidation end date). The benchmark sell-through rate is calculated for products grouped into Benchmark Groups. For example, if you have a seasonal product category, your Data Scientist can define this category as a Benchmark Group.
Example
Products in Benchmark Group 'summer-tshirt'
Liquidation end date = '2025-09-30'
- Last year's Sales (optimization period): 100
- Last year's sales (until '2024-09-30'): 850
Benchmark Sell-Through Rate would be 100/850 = 11.76%
Assuming Product A in 'summer-tshirt' group
- Predicted Sales in Optimization: 6
- Sales until Liquidation End Date: 6 / 11.76% = 51
Liquidation End Profit
Definitions
You can find all the referring KPIs in the Inventory section of the Optimization.
-
Sell Through Rate Target: Set your target for the percentage of stock you want to sell by the liquidation end date. Example: Sell Through rate Target is 80%, for a Stock of 100 products, 80 products will be aimed to be sold at the end of the season
-
Liquidation End Value: Is the set write-off price for your products at the end of the liquidation period.
-
Liquidation End: Is a date at which you would like to sell-off a product which could be the end of the season or the best before date
-
Liquidation End Profit: Sum of profit from sales until Liquidation End and write-offs from stock left-over at the Liquidation End date.
Liquidation End Profit = Profit in season + Profit at Liquidation End Date
-
Max Liquidation End Profit: The highest Liquidation End Profit available in the prediction among all price/marketing options
Liquidation End Profit Calculation
- Profit in Season (at the price of 91.49€):
Profit per productxSales until Liquidation End.
Example 26.35€ x 1791.78 = 47,211.6€
- Profit at Liquidation End (at the price of 91.49€):
Remaining stockx(Liquidation End Price - Purchase Price).
Example 1904 x (8.92€ - 29.75€) = −39,660.32€
- Total Liquidation End Profit (at the price of 91.49€):
Example
47,213.41€ - 39,660.32€ = 7,551.28€

Rule: Reach Max Liquidation End Profit x Value
You can use this rule to avoid moving too far away from prices that maximize your long-term profitability.
Example
Liquidation End Profit Max = 11,481.37 EUR (at the price of 83.49 EUR)
Value = 60%
Resulting rule: Liquidation End Profit > 6,888.82 EUR
This will force the optimizer to only allow prices and marketing options where the predicted Liquidation End Profit is bigger

Bundles
We define bundles as products that contain a combination of multiple other products.
Example
- 1 Pack of Aspirin Complex -> individual product
- 3 Pack of Aspirin Complex -> bundle product
Typical bundle issues
- The Price of the bundle product should follow the price of the individual product. Example: If the 1 Pack Aspirin Complex is reduced in price by 10%, you need to make sure, that the 3 Pack Aspirin Complex is still more affordable
- Stock is usually not stored separately for bundles. Stock therefore needs to be considered virtually for bundles. Example: if you have 10 packs of Aspirin Complex left, you can only sell a maximum of 3 bundles of 3 Packs of Aspirin Complex
Bundle data feed
To better handle bundle products, we ask for bundle information in a separate data feed. The way we ask for the data means, that each bundle will have a bundle_id AND a product_id.
| Column | Data Types | Description |
|---|---|---|
| product_id | Text | Unique product identifier |
| bundle_id | Text | Unique bundle identifier |
| product_qty | Integer, Decimal | Product quantity in bundle |
This data feed enables specific bundle rules that wouldn't be possible without it.
Rule: Bundle Price = Product Prices x Value
This rule sets the bundle price at a multiple of the price of the individual products.
Example
Price of 1 pack of Aspirin Complex after optimization = 11.49 EUR
Value = 95%
Price of 3 pack of Aspirin Complex after optimization: Bundle price = 11.49 x 3 x 95% = 32.75 EUR
Rule: Bundle Price < Product Prices x Value
This rule sets a maximum bundle price at a multiple of the price of the individual products.
Example
Price of 1 pack of Aspirin Complex after optimization = 11.49 EUR
Value 95%
Price of 3 pack of Aspirin Complex after optimization: Bundle price < 32.75 EUR
Product Groups
Product Groups give products, that belong together, one identifier in order to be optimized together. This helps keeping price distances within the group logical.
Example
- Aspirin Complex 20mg
- Aspirin Complex 40mg
- Aspirin Complex 60mg
Typical issue with product groups
The Prices of the products in a product group should be connected Example: If the price of "Aspirin Complex 20mg" is going down 10%, so should the price of "Aspirin Complex 40mg" to avoid a lower price per mg of the 20mg pack
Product Attribute data feed
To better handle product groups, we ask for the column "product_group_id" in the product attribute feed.
| Column | Data Types | Description |
|---|---|---|
| product_id | Text | Unique product identifier |
| product_group_id | Text | Unique group identifier |
This data feed enables to optimize the group together.
Optimization: Example
This rule sets the bundle price at a multiple of the price of the individual products.
Example
| Product Name | Product ID | Product Group | Price Change |
|---|---|---|---|
| Aspirin Complex 20mg | 660020 | PG6600 | +13% |
| Aspirin Complex 40mg | 660040 | PG6600 | +13% |
| Aspirin Complex 60mg | 660060 | PG6600 | +13% |
Further Details
Sometimes, you will have a logical product group like in our Aspirin example, but you still might want the prices to diverge, e.g. because you have separate suppliers for some of the products with independently changing purchase prices. In this case, if you still generally want to use the product group, we would recommend incorporating the supplier into the product group definition so the products with the same supplier can still move together.
The product group moving by the same percentage supersedes other rules if they should be at odds.
If you optimize a subset of the product group in a separate optimization, this will break the common pricing of the products, so be aware of that. If you intend a different steering for some products within a product group, you can achieve that by applying a different target steering within the same optimization.
Promotions
Promotions are more successful, if the preparation follows this three step approach:
- Gather historical data of promotion and their impact on sales and profitability
- Predict alternative scenarios for the future promotions using this historical data
- Decide on one promotion scenario that best fits the goal of the promotion
Types
We currently support to create scenarios for the following promotion types:
- Voucher: e.g. 20% on all products in the shop
- Discount: e.g. up to 70% discount on selected products
- Performance Marketing: e.g. Google Shopping campaign
Settings
Expectations for promotions differ substantially from expectations outside of promotions, which is why we recommend to to run them with different rules and targets.
| Recurring Optimizations | Promotion Optimizations | |
|---|---|---|
| Scopes | All products | Selected promotional scope |
| Rules | As little rules as possible | Constrains for promotions e.g. Discount > 20% |
| Targets | More focus on profitability e.g. "Max Profit" | More focus on Revenue e.g. "Profit Weight 50%" |
| Forecast | Main/Pricing forecast with normal voucher level | Use voucher scenarios like "10% Voucher Spending" if applicable |
| Date Range | 2 week date range | specific dates of the promotion |
| Uploads | Scheduled uploads | Manual one-time upload |
Promotion Scope
To select the products that should be in a promotion, we recommend creating a specific promotion scope in the "Scope" section. We provide a large range of options to select the products for a promotion:
- Select market, channel and an entire product category
- Select market, channel and specific products using their Product ID
- Select market, channel and an entire brand
- Select market, channel and Promotion Rank < 100 to use the 100 most recommended products
- Create a custom filter by using important KPIs like Sell Through Rate, Season, Liquidation End Stock or STR Liquidation End
Performance Marketing Optimization
Performance Marketing optimization helps you make data-driven decisions to enhance campaign performance on platforms like Amazon and Google Shopping. Our tool not only collects and analyzes your data but also simulates different marketing scenarios to ensure your products are placed in the most effective campaigns. This strategic structuring allows Google and Amazon algorithms to further optimize within their framework.
Our tool structures campaigns in the best possible way from the outset. By setting revenue and profit targets, you receive data-driven recommendations on how to allocate marketing efforts for maximum impact. This ensures each product is assigned to the most suitable campaign before platform-specific optimizations take place.
Analyzing Your Marketing Campaign Data
Our tool integrates directly with marketing platforms via API to gather key traffic data, including:
- Organic and paid clicks
- Conversions
- Marketing spend
- Competitor prices
Additionally, we leverage data already used for price optimization, such as return rates, outbound costs, and stock availability, to provide a comprehensive view of your marketing landscape. Instead of manually compiling and analyzing data, you gain clear, actionable insights.
Forecasting Different Marketing Scenarios
Once your campaign data is collected and refined, our tool analyzes the impact of various marketing strategies. You can test different goal settings (e.g., maximizing revenue or profit) and see how they affect:
- Traffic and conversions
- Click-through rates (CTR)
- Cost per click (CPC)
By evaluating different scenarios, you can identify the most effective strategy while minimizing risks and improving overall campaign structure.
Aligning Marketing with Pricing Strategy
A common challenge is the disconnect between marketing and pricing decisions. Our tool synchronizes both, ensuring:
- Product prices align with campaign goals
- Automatic adjustments based on price changes
- Identification of profitable discount and promotion opportunities
Order Optimization
Generate forward-looking, data-driven order recommendations that reduce profit losses and improve inventory efficiency — all by leveraging your already integrated pricing and marketing data, with no additional data integration required.
- Sales Forecasting: Analyzes historical data — including out-of-stock periods, seasonal trends, and long-term patterns — to generate a reliable sales forecast.
- Customizable Rule-Engine: Impact factors and rules are fully customizable, allowing the logic to adapt to your business needs.
- Account for Future Pricing Strategies: Considers upcoming changes to your pricing strategies to optimize order volumes ahead of time.
- Data-Driven Recommendations: Outputs accurate, product-level order quantity suggestions for a pre-defined time frame.
Output
All order quantity recommendations are transparent and explainable, giving you full confidence in every ordering decision on product level:
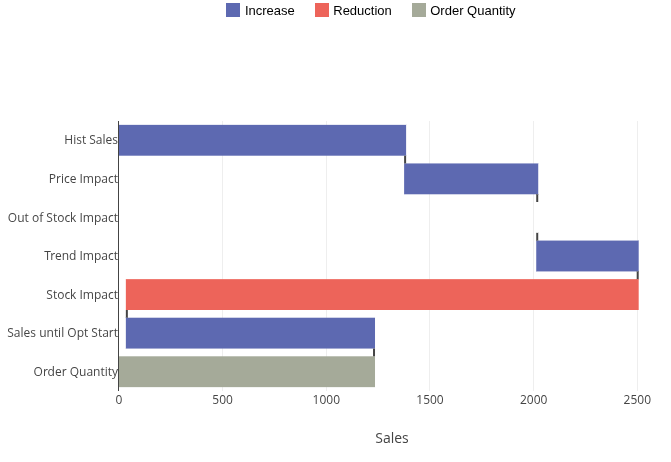
The Order Quantity recommendation is built on a robust demand forecast that factors in:
- Historical sales patterns
- Anticipated pricing changes
- Adjustments for out-of-stock periods
- Broader sales trends
From this demand forecast, we
- Deduct current stock and incoming deliveries
- Add expected sales until the optimization start date
The result is a granular, product-level order quantity that aligns seamlessly with your inventory processes and supports channel-specific planning.
Exploit Synergies between Ordering and Pricing
For maximum impact, combine Order Optimization with Stock-Based Pricing. This powerful synergy helps you minimize out-of-stock and overstock situations while maximizing your target KPIs — whether you're focused on revenue, profit, or turnover.
tRoas
tROAS (Target Return on Ad Spend) is a bid strategy used in digital advertising, particularly in platforms like Google Ads, where you can set a desired return on ad spend as a percentage. The algorithm then automatically adjusts bids to maximize conversion value while trying to achieve the specified return.
How tROAS Works on platforms like google:
- You set a target ROAS (e.g., 400% means you want 4€ in revenue for every 1€ spent).
- The algorithm adjusts bids in real-time to maximize conversion value while aiming for the target.
- Higher tROAS means the algorithm prioritizes efficiency over volume, leading to fewer but more profitable conversions.
- Lower tROAS means the algorithm prioritizes more conversions, even if they’re less profitable.
Marketing Option: tRoas⁻¹
Our tool uses inverted tROAS displayed as tROAS⁻¹ as Marketing Option to make marketing steering more intuitive. Instead of comparing tRoas directly (which can feel counterintuitive), the Marketing Option tRoas⁻¹ value gives you a clear sense of how aggressively you're pushing your marketing:
- Lower Marketing Option tRoas⁻¹ → Less aggressive marketing
- Higher Marketing Option tRoas⁻¹ → More aggressive marketing
How to Calculate it
1. tRoas to Marketing Option tRoas⁻¹
If you want to check the Marketing Option, just divide 100 by the tRoas (expressed as a whole number):
Example:
A tRoas of 1,298.70% - moderate steering
100 ÷ 12.987 = 7.7
Marketing Option tRoas⁻¹: 7.7%
A tRoas of 952.38% - more aggressive steering
100 ÷ 9.5238 = 10.5
Marketing Option tRoas⁻¹: 10.5%
This way, instead of dealing with percentage comparisons, you get a clear and simple scale to guide your decisions.
2. Marketing Option tRoas⁻¹ to tRoas
If you have a Marketing Option tRoas⁻¹ and want to find the corresponding tRoas (in percentage), simply divide the Marketing Option Float by 100.
Example:
A Marketing Option of 7.7 tRoas⁻¹ - moderate steering
100 ÷ 7.7 = 12.987 → 1,298.70%
A Marketing Option of 10.5 tRoas⁻¹ - more aggressive steering
100 ÷ 10.5 = 9.5238 → 952.38%
tRoas and Marketing Option
This table shows common tRoas values and their corresponding Marketing Option Float and Marketing Option tRoas⁻¹ for easier reference.
| tRoas (%) | Marketing Option Float | Marketing Option tRoas⁻¹ |
|---|---|---|
| 10,000.00% | 1.0 | tROAS⁻¹: 1.0% |
| 7,500.00% | 1.3 | tROAS⁻¹: 1.3% |
| 5,000.00% | 2.0 | tROAS⁻¹: 2.0% |
| 3,500.00% | 2.9 | tROAS⁻¹: 2.9% |
| 2,500.00% | 4.0 | tROAS⁻¹: 4.0% |
| 2,000.00% | 5.0 | tROAS⁻¹: 5.0% |
| 1,500.00% | 6.7 | tROAS⁻¹: 6.7% |
| 1,200.00% | 8.3 | tROAS⁻¹: 8.3% |
| 1,000.00% | 10.0 | tROAS⁻¹: 10.0% |
| 800.00% | 12.5 | tROAS⁻¹: 12.5% |
| 600.00% | 16.7 | tROAS⁻¹: 16.7% |
| 400.00% | 25.0 | tROAS⁻¹: 25.0% |
Output Options
You have three convenient options for exporting data from our tool to your system:
A. Manually download the integration file to your computer and manually upload it into system. B. Manually upload the integration file using an API to your system C. Automatically upload the integration file using an API to your system
We always customize the data export format for each customer, so that you can decide which KPIs should be in these export files. It is also possible to export multiple files. The integration files have to be configured by the 7Learnings support team.
A. Manually download the integration file
- In the Optimizations section, locate the optimization you wish to use
- On the right, click the "Up-/Download" button and select the integration file you would like to download
- Upload the downloaded file from your computer to your system
B. Manually Upload the integration file
- In the Optimizations section, locate the optimization you wish to use
- On the right, click the "Up-/Download" button and select "Create Upload" from the popup menu.
- Configure the upload by specifying the following options:
- Reviewers: Assign a reviewer responsible for approving the changes before the upload. If you select yourself as a reviewer, the changes will be approved automatically
- Upload configuration: Choose the upload configurations that will be used for this upload. You can select multiple configurations to send the integration file to different locations
- Upload channels: Specify which upload channels will receive the changes. If no upload channels are selected, the changes will be sent to all available upload channels
- Click "Create Upload" to finalize the process.
- If you assigned the review to someone other than yourself, the upload will require additional approval from the designated reviewers.
C. Automatically upload the integration file
Please refer to the Scheduled Uploads help section.
Approving an Upload
- To review the pending upload, click the "View Optimization" button (represented by the eye symbol) in the Uploads section for the relevant upload
- After reviewing the changes, you can leave a comment regarding the optimization or proceed to approve and upload the changes
- Once the changes are approved, they will be uploaded automatically. A double tick symbol will indicate that the upload was successful once completed
Upload Scheduling
Scheduled uploads offer a seamless way to automate your price updates, ensuring that your pricing information is always current and accurate. By establishing specific intervals for uploads, you can minimize manual intervention. Once set up, scheduled uploads will automatically create optimizations, prepare price changes for review before uploading, or, in the case of automated uploads, execute the changes immediately.
Creating a Scheduled Upload
-
In the Uploads section, click the "Create" button in the top left corner to start a new scheduled upload.
-
Configure the scheduled upload. The setup process is similar to creating a manual upload and includes the following options:
- Optimization to copy settings from: Select an existing optimization from the Optimization section to base this scheduled upload on. This will copy the selected scopes, rules, and steering targets.
- Upload frequency and schedule: Choose how often the upload should occur (daily or weekly) and specify the exact times. By clicking on the weekdays, you can easily select the days of the week when the upload should take place.
- Reviewers: Assign a reviewer responsible for approving the price changes before the upload. Alternatively, you can opt for an automated upload, which does not require manual approval.
- Automated Upload: If selected, the price changes will be uploaded immediately upon optimization creation, bypassing the need for manual approval.
- Upload configuration: Choose the upload configurations that will be used for the scheduled uploads. You can select multiple configurations to send price changes to different locations.
- Upload channels: Specify which upload channels will receive the price changes. If no upload channels are selected, the price changes will be sent to all available upload channels.
-
After finalizing the configuration, click the "Create Scheduled Upload" button to complete the process.
Approving and Uploading a Scheduled Upload
Note: This section is not applicable for automated uploads, which do not require approval and are uploaded immediately upon optimization creation.
- After the optimization was created automatically, it must receive approval from one of the designated reviewers before any price changes can be uploaded. To review the pending price changes of a scheduled upload, click the "View Optimization" button (represented by the eye symbol).
- After reviewing the price changes in the Optimization View, you can leave a comment regarding the optimization or proceed to approve and upload the changes.
- Once the price changes are approved, they will be uploaded automatically. A double tick symbol will indicate that the upload was successful once completed.
Upload Evaluation
We offer several metrics that enable retrospective evaluation on our predicted sales, profit and revenue. In short, you can see if our past predictions match what occurred in reality.
Live Share
The live share is the percentage of products in the optimization for which the recommended price is actually online/active. Please keep in mind that the older the optimization, the more irrelevant/outdated this share becomes, so be sure to refer to the latest optimizations if you want to know the live share.
Profit Impact
The profit impact refers to the difference between the actual (realized) profit and what the profit would have been without the optimization. This is in the context of the time period and products covered by the optimization. For example, if you uploaded an optimization 7 days ago, we calculate the actual profit generated by the products that were part of this optimization for the past 7 days and compare it to the "potential" profit these products would have generated had you not done the optimization. This "potential" profit is the one derived from the status quo point (green point in the preview curve), which just predicts the profit if you "do nothing" and keep the prices unchanged. Note that the profit metric here is calculated for all sales before returns.
Revenue Impact
The revenue impact is analogous to the profit impact, with the exception that the metric we are now measuring is the revenue.
Understanding Impact
In order to better understand how we actually calculate the impact, it's best to illustrate with an example. Let's say that two weeks ago, we have created an optimization, "X", which covers a period of two weeks and the steering strategy was "Max Profit". For this optimization, today we say that the profit impact is 2,000 EUR. In order to come up with this value, we look at two things:
- The realized (actual) profit generated by the products which were part of Optimization X during these two weeks.
- The predicted profit of Optimization X for the scenario where we would not have done the optimization (Status Quo or “Do Nothing”).
Let's assume that this predicted profit for “Do Nothing” is 10,000 EUR. Also, let's assume that the actual profit is 12,000 EUR. In this case, the profit impact would be 12,000 - 10,000 = 2,000 EUR. So, because we steered for Max Profit rather than doing nothing, we generated an extra 2,000 EUR, which are attributed to the steering strategy.
Please keep in mind that this impact is an incremental (relative) impact. Incremental in the sense that we always compare our tool against itself, because the “Do Nothing” scenario of the current optimization is nothing more than the “Max Profit” scenario of the previous optimization. So, the current prices (“Do Nothing”) are always the suggested prices of the previous upload (“Max Profit”). This calculation only makes sense in the context of a continuous use of the tool.
The "absolute" impact, which answers the question: "What would the profit have looked like, had we not used the tool at all?" is not shown here and is not easily quantifiable. The only reasonable way to answer this question would be to perform an A/B test. It compares results with and without the tool under similar conditions, isolating our tool's overall effect.
Sales Accuracy
The sales accuracy is of predicted sales before returns in the optimization divided by the sum of the actual sales before returns over the same period of time. For example, if we predict 100 sales before returns in the next two weeks, and in reality, only 90 sales were realized, then this value would be 90%. Values close to 100% indicate good predictability. Values above or below that indicate overprediction or underprediction respectively.
Upload Filters
When uploading optimization results to a destination—either via scheduled uploads or manual upload creation—it is possible to further refine the scope of the results. To enable this, an additional field will be available for selection during the upload creation process.

The Upload Channel Filter dropdown menu lists all combinations of identifiers defined in the Data Channels feed. Depending on how "Data Channels" is configured, the number of available combinations may vary. For more details, refer to the Initial Data Request document.
How Filters Are Defined
Filter options are created by joining all available identifiers in the project. This includes standard channel definitions such as Market = DE and Channel = Zalando. If your project utilizes Shadow Channels, these options will be extended accordingly.
What Are Shadow Channels?
Shadow Channels provide additional mapping definitions for the primary two-level identifiers (Market, Channel). They are particularly useful for replicating optimized prices to platforms with different market or channel definitions. Common uses of Shadow Channels include:
Example 1: Mapping Main Regions/Countries to Shadow Countries
Shadow Channels can abstract multiple sales countries by region. For example, suppose prices are optimized for the Polish market (Market = PL, Channel = Webshop) because it is the largest market in a region where your company operates. Instead of optimizing prices for each country, you can define Shadow Channels for related countries (e.g., CZ, BG, SK) and replicate the Polish prices, converted into local currencies, for these markets.
This setup allows you to optimize prices once for the main market-channel combination and replicate them for corresponding shadow channels, as illustrated below:
| Market | Channel | Shadow Market | Shadow Channel |
|---|---|---|---|
| PL | Webshop | PL | Webshop |
| PL | Webshop | HR | Webshop |
| PL | Webshop | CZ | Webshop |
| PL | Webshop | EE | Webshop |
| PL | Webshop | HU | Webshop |
| PL | Webshop | LV | Webshop |
| PL | Webshop | LT | Webshop |
| PL | Webshop | BG | Webshop |
| PL | Webshop | SK | Webshop |
| PL | Webshop | SI | Webshop |
Using the shadow market and channel definitions, you can filter exports to a subset of channels. For instance, you might choose to export prices only for PL, HR, and CZ, rather than all defined countries. The upload filter setup enables granular control over exports when abstraction levels exceed the project's scope definition.
| Upload Filter |
|---|
| PL - Webshop - PL - Webshop |
| PL - Webshop - HR - Webshop |
| PL - Webshop - CZ - Webshop |
Example 2: Mapping Main Regions/Countries to Integrator-Specific Keys (e.g., Tradebyte)
Shadow Channels can also function as a translation layer between regions and integrator-specific keys associated with those regions. For example, consider using Tradebyte as an integration platform for uploading to a marketplace like Zalando:
| Market | Channel | Shadow Market | Shadow Channel |
|---|---|---|---|
| DE | Zalando | DE | zade |
| DE | Zalando | BE | zafb |
| DE | Zalando | BE | zafh |
| DE | Zalando | HR | zazfshr |
| DE | Zalando | CZ | zazfscz |
| DE | Zalando | DK | zazfsdk |
| DE | Zalando | EE | zazfsee |
| DE | Zalando | FI | zazfsfi |
| DE | Zalando | FR | zaff |
In this example, optimized prices for the main Market = DE and Channel = Zalando are replicated to other Zalando channels in different countries. The upload filter allows you to export optimized prices for the main channel and a selected subset of subchannels directly into Tradebyte.
| Upload Filter |
|---|
| DE - Zalando - DE - zade |
| DE - Zalando - BE - zafb |
| DE - Zalando - FR - zafr |
| DE - Zalando - DK - zazfsdk |
| DE - Zalando - FI - zazfsfi |
Summary
The Upload Channel Filter feature allows to precisely control the scope of optimization results being uploaded. By leveraging standard and shadow channel definitions, exports can be filtered to specific market-channel combinations. This functionality provides flexibility to target only relevant markets or platforms, whether for manual or automated uploads.
Notes
-
Since export combinations are computed dynamically, the list of available options is not filtered by what the optimization contains. This means that all possible combinations defined in the data are shown, even if no products in the optimization map to those specific market-channel combinations.
-
Filters can be applied not only to manual uploads but can also be saved as templates for automated uploads, enabling seamless integration into recurring workflows.
Pipeline Status
You can check the status of the most recent forecast in the upper right corner next to this info page:

-
In progress: If the creation of your forecast is in progress, the current step of the pipeline is shown like this:
ML Models in progress now.
-
Success: If the forecast is successfully created, it will be displayed like this:
Successful Pipeline Run: Forecast completed 3 hours ago.
-
Failure: If the forecast failed we provide the step for better orientation. Below you can find more details if there is action from you required:
Data Processing failed 10 hours ago.
Failure: Explanation and what to do about it
If your pipeline failed, you can check here for more details and any required actions:
-
Data Import: An issue occurred while loading your data. If you do not see any specific error, we will contact you via email if any action is needed on your side.
Action: In case a specific action is requested from you in the pipeline status, please update the data accordingly. After you updated the data, please contact your Data Scientist. Once data is updated, we will rerun the pipeline, and your forecast will be available soon.
-
Data Processing: An issue occurred while processing your data. If you do not see any specific error, we will contact you via email if any action is needed on your side.
Action: In case a specific action is requested from you in the pipeline status, please update the data accordingly. After you updated the data, please contact your Data Scientist.
-
Forecast: An issue occurred during the forecast step. Your Data Scientist is reviewing the issue.
Action: No action is required from you.
-
Monitoring: An issue occurred during the monitoring step. Your Data Scientist is reviewing the issue.
Action: No action is required from you.
-
Quality Assurance: If the model's performance drops compared to the last successful forecast, the pipeline will stop, and your Data Scientist will be notified. We are reviewing and improving the models at the moment to ensure accurate forecasts. Once updated, we will rerun the pipeline, and the forecast will be available soon.
Action: No action is required from you.
-
Deploy Integration: An issue occurred during the integration deployment step. Your Data Scientist is reviewing the issue.
Action: No action is required from you.